
 Home
Home News
News

- 1 FUBO stock price is currently trading at $2.54 with a gain of 1.20% in the last 24 hours with a current market cap of $743.164 Million.
- 2 Technical indicators highlight the consolidation phase of FUBO Stock.
FUBO price prediction suggests bears and bulls are yet to gain a proper grasp on the trend. Investors might prefer to wait for a confluence of multiple technical indicators in order to decide the direction of the trend.
There is a slight increase in the green volume candles which suggests the FuboTV price is attracting buyers at the demand zone. Investors regarding the FUBO price are indecisive at present and may remain negative unless the buyers start stepping into the price action with substantial momentum.

However, according to the technical indicators and price action, the odds are lining in the bulls’ favor. FUBO stock price needs to attract buyers to surge towards the upper trendline of the consolidation phase over the daily time frame chart.
Meanwhile, the FUBO share price is trying to gather support and surge towards the 200-day daily moving average. FUBO shares have been consolidating inside the horizontal price range of $2.56 and $2.35.
Nevertheless, FUBO stock price has gained around 3.67% in a week but gained 16.72% in a month. Also, the FuboTV share price shed around 19.37% in the last three months and gained 106.50% over the last six months. Additionally, it gained 43.50% year-to-date. The performance data highlights the recent weakness in FUBO stock.
FUBO Stock Price Has Been Consolidating Inside a Price Range
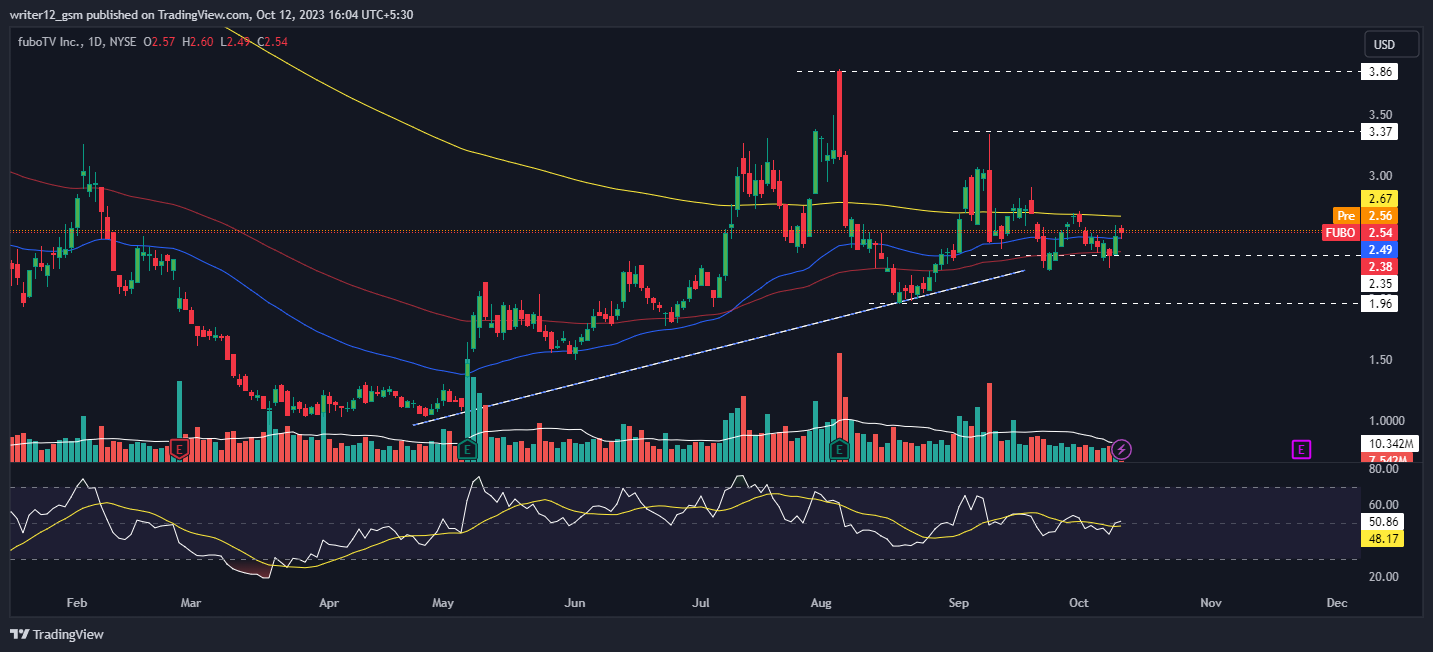
FUBO stock price must initiate its recovery rally to reach the upper threshold of the consolidation phase. However, the FUBO shares need to accumulate buyers in order to surge towards its recovery phase. Meanwhile, the FUBO share price has jumped above the 50 and 100-day daily moving averages.
Technical indicators highlight the consolidation phase of the FUBO stock price. Relative strength index (RSI) showcases the sideways momentum of FUBO shares. RSI was at 50 in the neutral territory.
MACD exhibits the consolidation phase of the FUBO share price. The MACD line is flat above the signal line waiting for a crossover. Investors in FUBO stock need to wait for any directional change over the daily time frame chart.
Summary
On the daily time frame chart, the FUBO stock price has been consolidating in a horizontal price range. However, in order to accelerate toward its recovery phase, FUBO shares must amass purchasers. Technical indicators point to a period of price consolidation for the FuboTV stock. Investors in FUBO stock must watch the daily time frame chart for any directional changes.
Technical Levels
Support Levels: $2.35 and $1.96.
Resistance Levels: $3.37 and $3.86.
Disclaimer
The analysis provided in this article is for informational and educational purposes only. Do not rely on this information as financial, investment, or trading advice. Investing and trading in stock involves risk. Please assess your situation and risk tolerance before making any investment decisions.

Nancy J. Allen is a crypto enthusiast, with a major in macroeconomics and minor in business statistics. She believes that cryptocurrencies inspire people to be their own banks, and step aside from traditional monetary exchange systems. She is also intrigued by blockchain technology and its functioning. She frequently researches, and posts content on the top altcoins, their theoretical working principles and technical price predictions.


