
 Home
Home News
News
- 1 THORChain price (RUNE) surged 10.73% in the last 24 hours and currently trades at $1.67.
- 2 RUNE crypto price bounced back from the 200-day EMA.
- 3 The daily price chart witnessed the formation of an inclining parallel channel pattern.
THORChain price witnesses the formation of an inclining parallel channel pattern over the daily chart with the price currently hovering near the lower boundary of the channel. The RUNE crypto price delivers a bullish outlook above the key exponential moving averages of 50-day and 200-day EMA.
The RUNE daily chart analysis elaborates that the crypto price has been showing an upthrust since mid-August 2023 when the crypto price broke above the 50-day EMA. The breakout was supported by a rising volume, thus, turning the overall trend optimistic in the short term.
Furthermore, the price has gained over 75% since August and is headed upwards respecting an inclining parallel channel. Recently, the crypto price tried to break below the lower boundary of the channel but failed to close below as the bulls surged the price to close in the channel.
The volume analysis shows that the THORChain crypto price has a trading volume of $123.20 Million in the past 24 hours which is 94.60% more than the last day. The crypto has a market cap of $564.66 Million and ranks 60th in the crypto market. The volume-to-market-cap ratio is 21.33% indicating mild volatility in the market.
THORChain Price Forms An Inclining Parallel Channel Pattern
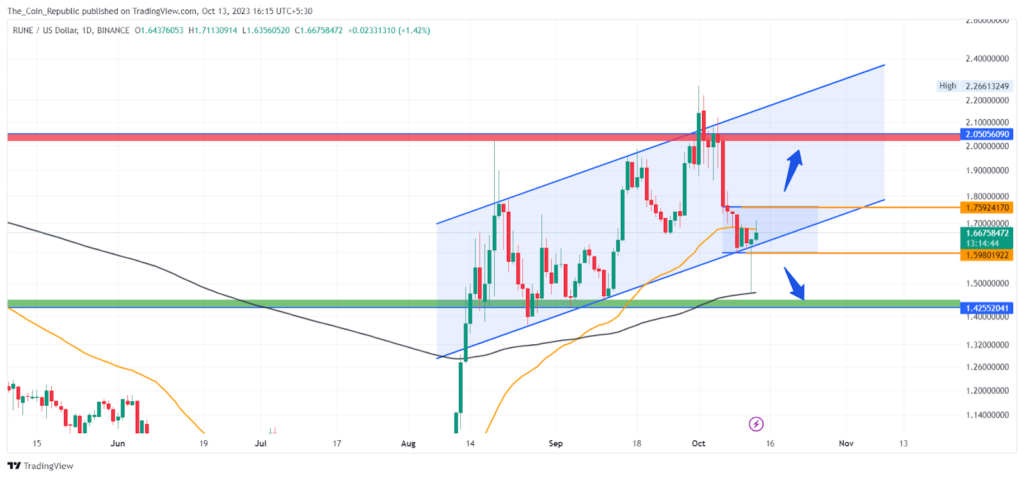
The THORChain price currently trades at $1.67 with an intraday gain of 10.73%. The RUNE price hovers near the lower boundary of the parallel channel pattern from where bulls may try to surge the price higher.
Moreover, the breakdown of the channel pattern may add some bearishness in the short term and the RUNE price might slide to the lower levels. If the price declines, it might correct till the 200-day EMA.
Technical Indicators Show Bears Losing Momentum In The Short Run
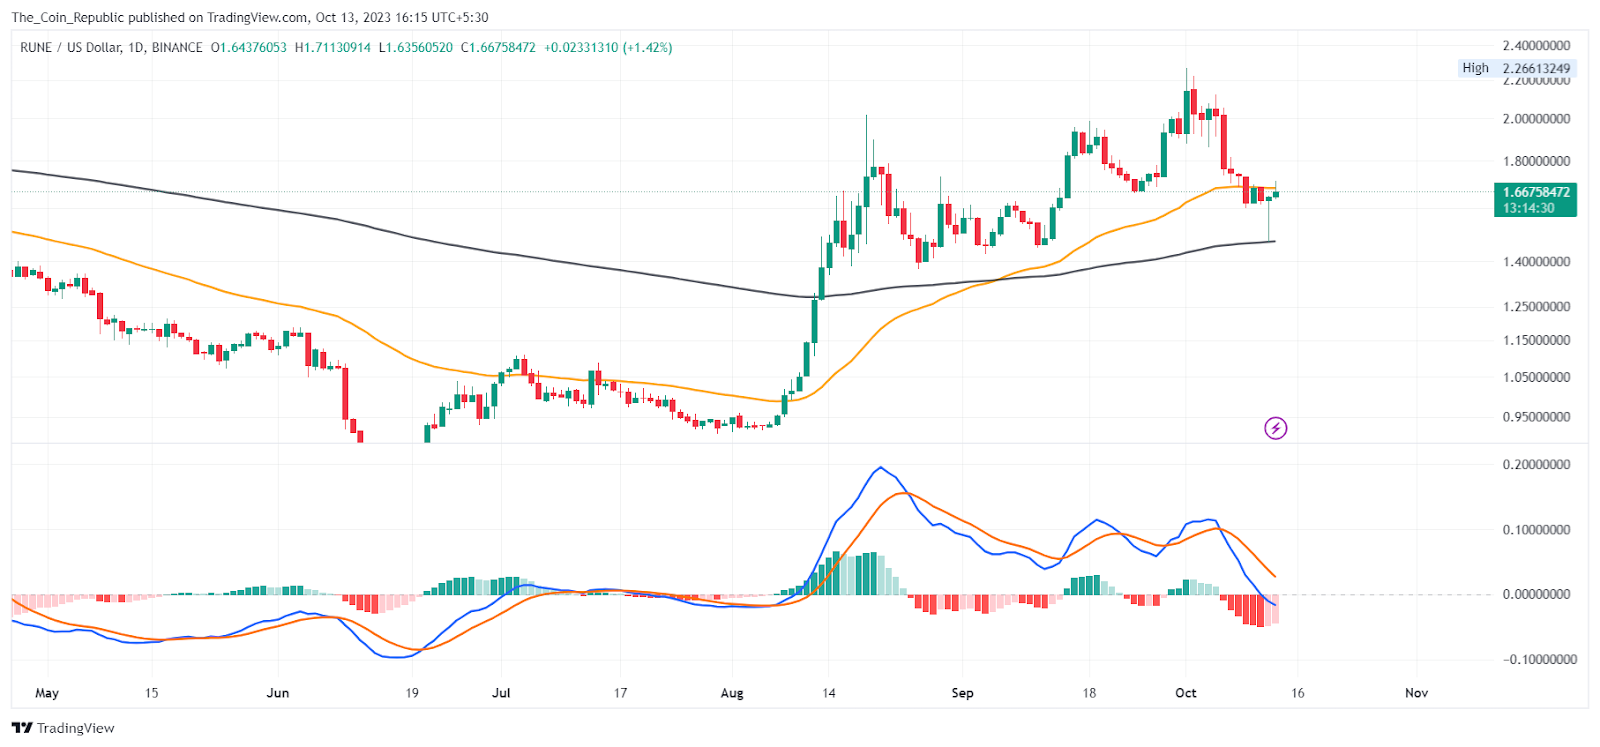
MACD lines are showing a negative crossover. The histogram bars are formed below the mean line of decreasing height, indicating the fading bears’ momentum and how the price might show some gains in the upcoming sessions.
The EMA analysis shows that the RUNE price is trying to sustain near the 50-day EMA indicating the bulls are trying to dominate in the short term. The price bounced back from the 200-day EMA indicating bulls’ presence at the lower levels.
Conclusion
THORChain price surged by 75% since August and forms a rising channel pattern. The price currently hovers near the channel’s lower boundary at $1.67, up by 10.73% today. The price may bounce back or break down the channel. The volume is $123 Million, up by 94.60%. The market cap is $565 Million.
The volume-to-market-cap ratio is 21.33%, indicating mild volatility. The price is above the 50-day and 200-day EMA, showing a bullish trend. The breakdown may lead to a correction till the 200-day EMA.
Technical Levels
- Support Levels: $1.59 and $1.425
- Resistance Levels: $1.759 and $2.050
Disclaimer
The views and opinions stated by the author, or any people named in this article, are for informational purposes only and do not establish financial, investment, or other advice. Investing in or trading crypto or stock comes with a risk of financial loss.

Adarsh Singh is a true connoisseur of Defi and Blockchain technologies, who left his job at a “Big 4” multinational finance firm to pursue crypto and NFT trading full-time. He has a strong background in finance, with MBA from a prestigious B-school. He delves deep into these innovative fields, unraveling their intricacies. Uncovering hidden gems, be it coins, tokens or NFTs, is his expertise. NFTs drive deep interest for him, and his creative analysis of NFTs opens up engaging narratives. He strives to bring decentralized digital assets accessible to the masses.


