
 Home
Home News
News
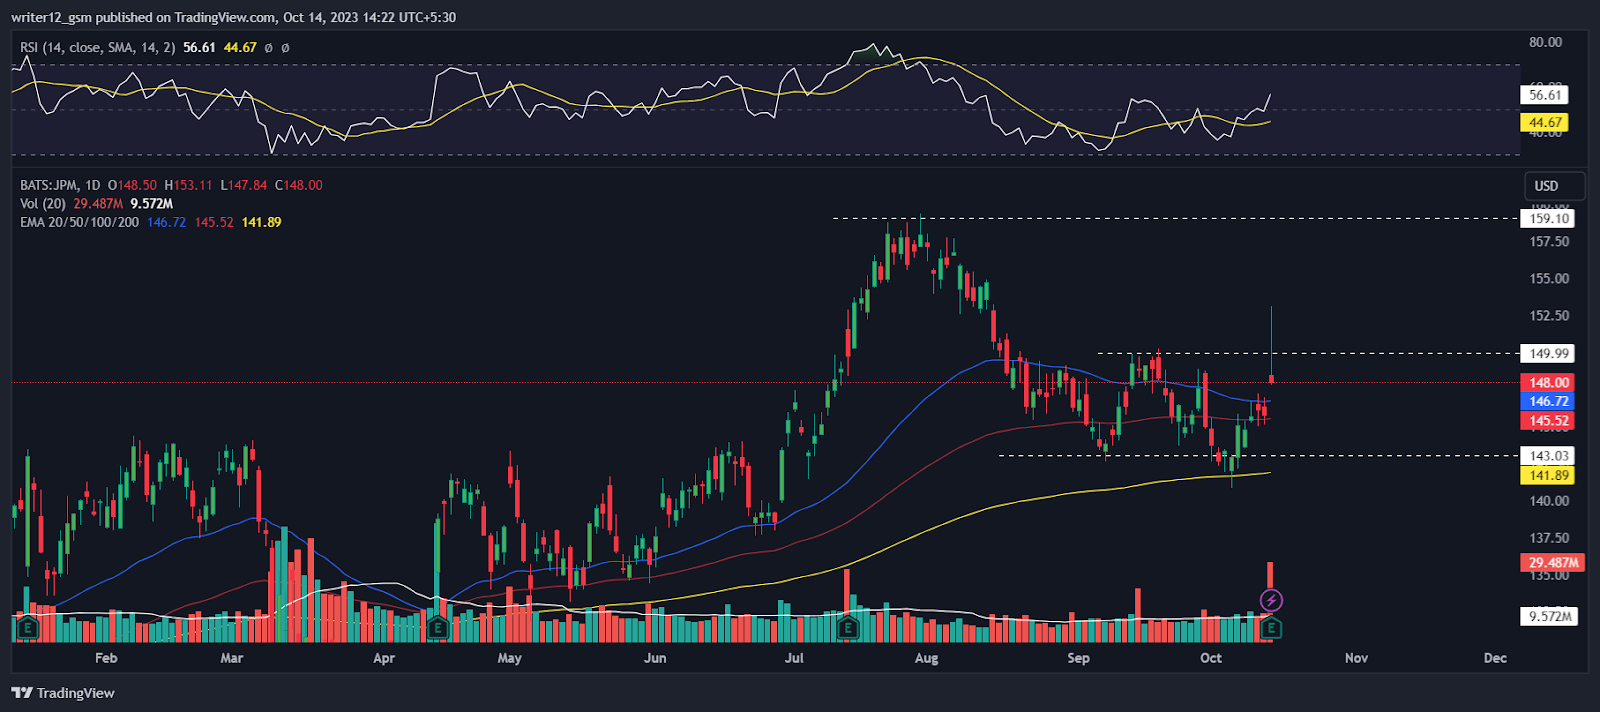
- 1 JPM stock price taking strong rejection from the $150.00 level.
- 2 JPM stock is range bound, consolidating in a range.
JPM stock price prediction suggests bears and bulls are yet to gain a proper grasp on the trend. Investors might prefer to wait for a confluence of multiple technical indicators in order to decide the direction of the trend. There is a slight increase in the green candles of volume which suggests the JPM price is attracting buyers at the demand zone.
Investor sentiments regarding the JP Morgan price are indecisive at present and may remain negative unless the buyers start stepping into the price action with substantial momentum. However, according to the technical indicators and price action, the odds are lining in the bears’ favor.

JPM stock price needs to attract buyers to surge towards the upper trendline of the consolidation phase over the daily time frame chart. Meanwhile, the JP Morgan share price is trying to gather support and sustain above the 20, 50, 100, and 200-day daily moving averages. JP Morgan shares have been consolidating inside the horizontal price range of $143 and $150.
Nevertheless, JP Morgan’s stock price gained around 3.56% in a week and around 0.45% in a month. Also, the JPM share price dropped around 2.34% in the last three months and 9.51% over the last six months. Year to date it gave a negative return of 9.44%.
JPM Stock Price Technical Analysis
JPM stock price must initiate its recovery rally to reach the upper threshold of the consolidation phase. However, the JP Morgan shares need to accumulate buyers in order to surge towards its recovery phase. Meanwhile, the JP Morgan share price has been trading above the 50, 100, and 200-day daily moving averages.
Moreover, JP Morgan stock must register its breakout from the consolidation phase over the daily time frame chart. Technical indicators suggest the consolidation phase of the JP Morgan stock price. Relative strength index (RSI) showcases the sideways momentum of JP Morgan shares. RSI was at 56 and is heading towards the overbought territory.
MACD exhibits the consolidation phase of the JPM stock price. The MACD line is flat above the signal line waiting for any type of crossover. Investors in JP Morgan stock need to wait for any directional change over the daily time frame chart.
Summary
On the daily time frame chart, the JP Morgan stock price has been consolidating between the horizontal price bands of $143.03 and $149.99 per share. However, in order to accelerate towards its recovery phase, JP Morgan shares must amass purchasers. Technical indicators point to a period of price consolidation for the JPM stock. Investors in JP Morgan stock must watch the daily time frame chart for any directional changes.
Technical Levels
Support Levels: $145.00 and $143.03
Resistance Levels: $150.00 and $159.00
Disclaimer
The analysis provided in this article is for informational and educational purposes only. Do not rely on this information as financial, investment, or trading advice. Investing and trading in stock involves risk. Please assess your situation and risk tolerance before making any investment decisions.
Steve Anderson is an Australian crypto enthusiast. He is a specialist in management and trading for over 5 years. Steve has worked as a crypto trader, he loves learning about decentralisation, understanding the true potential of the blockchain.


