
 Home
Home News
News
- 1 Trust Wallet crypto price is currently trading at $0.96521781 with a drop of 1.45% in the last 24 hours.
- 2 TWT has a current market cap of $402.158 Billion.
Trust Wallet price prediction suggests that the TWT crypto is presently moving on an uptrend, breaking out of the bears’ stronghold. The price is above the critical EMAs on the daily time frame. The volume declined slightly which indicates that there is a fall in buying and selling activity.
If the price gains buyers’ support at the present level, it could surge near the price of $1.0 within the next few weeks, whereas the immediate support level for the token is around $0.8207829. The price movements are relevantly more stable for TWT crypto than other major cryptocurrencies.
The buyers have an adequate probability of attaining the expected target if they are able to sustain above the 200 EMA which would put the anticipated outcome in the bulls’ favor.
Trust Wallet price has been in a bull trend for the past few months. After breaking out, TWT crypto price has been finding consistent support from the bulls from the trendline. Observing the historical price action, it can be estimated that the 200 EMA level has been acting as a crucial demand zone.
Technical Analysis of Trust Wallet Crypto Price in 1-D Time Frame
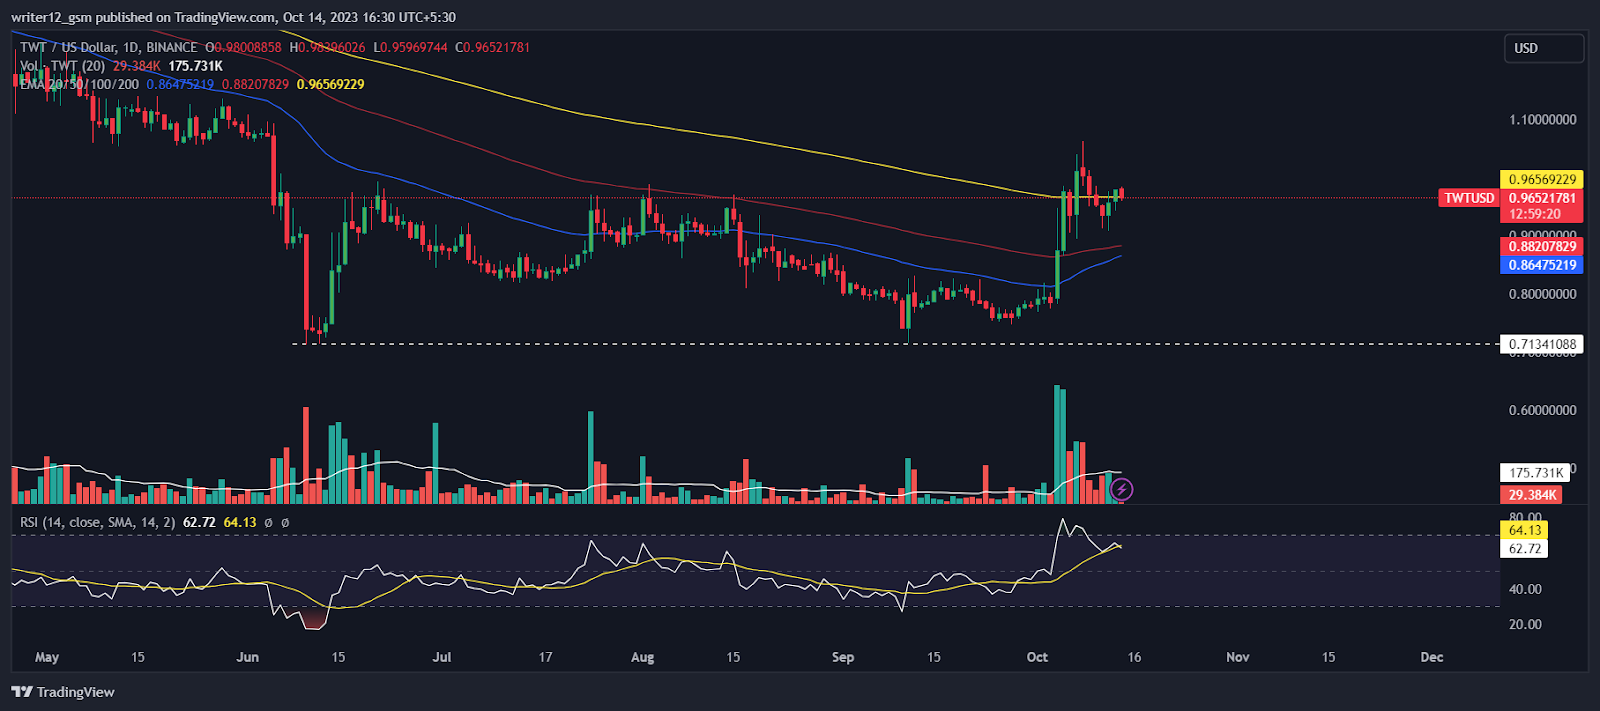
Trust Wallet (USD: TWT) price has been rising steadily over the past three months, gaining 14.75%. It gained 23.53% last month. At press time, TWT crypto was $0.96521781 and has been trying to hold on to this level after an unexpected surge in price.
If it can sustain at this level, Trust Wallet price could continue to go up and reach the first and second targets of $1.00 and $1.100, respectively. However, if the TWT price cannot maintain this level and falls, then it might hit the closest support levels of $0.88209737 and $0.86478998.
Currently, Trust Wallet crypto (USD: TWT) is trading above the 50 and 200-day exponential moving averages (EMAs), which are supporting the price momentum.
However, if buying volume adds up, then the price might support bullish momentum by making higher highs and new highs. Hence, the Trust Wallet price is expected to move upwards giving bullish views over the daily time frame chart.
The current value of RSI is 62.90 points. The 14 SMA is above the median line at 64.14 points which indicates that the Trust Wallet crypto is bullish.
The MACD line at 0.04615877 and the signal line at 0.03762419 are above the zero line. A bullish crossover is observed in the MACD indicator which signals strength in the momentum of the TWT crypto price.
Summary
Trust Wallet (USD: TWT) technical oscillators support the bullish trend. The MACD, RSI, and EMAs are emphasizing positive signs and imply that the uptrend may continue in the TWT crypto price. Price action suggests that the investors and traders are bullish on the 1-day time frame. The price action reflects a bullish perspective at the moment. However, investors and traders should wait for proper setup for the next move and avoid FOMO.
Technical Levels
Support Levels: $0.88209737 and $0.86478998.
Resistance Levels: $1.00 and $1.100.
Disclaimer
This article is for informational purposes only and does not provide any financial, investment, or other advice. The author or any people mentioned in this article are not responsible for any financial loss that may occur from investing in or trading. Please do your own research before making any financial decisions

Adarsh Singh is a true connoisseur of Defi and Blockchain technologies, who left his job at a “Big 4” multinational finance firm to pursue crypto and NFT trading full-time. He has a strong background in finance, with MBA from a prestigious B-school. He delves deep into these innovative fields, unraveling their intricacies. Uncovering hidden gems, be it coins, tokens or NFTs, is his expertise. NFTs drive deep interest for him, and his creative analysis of NFTs opens up engaging narratives. He strives to bring decentralized digital assets accessible to the masses.


