
 Home
Home News
News
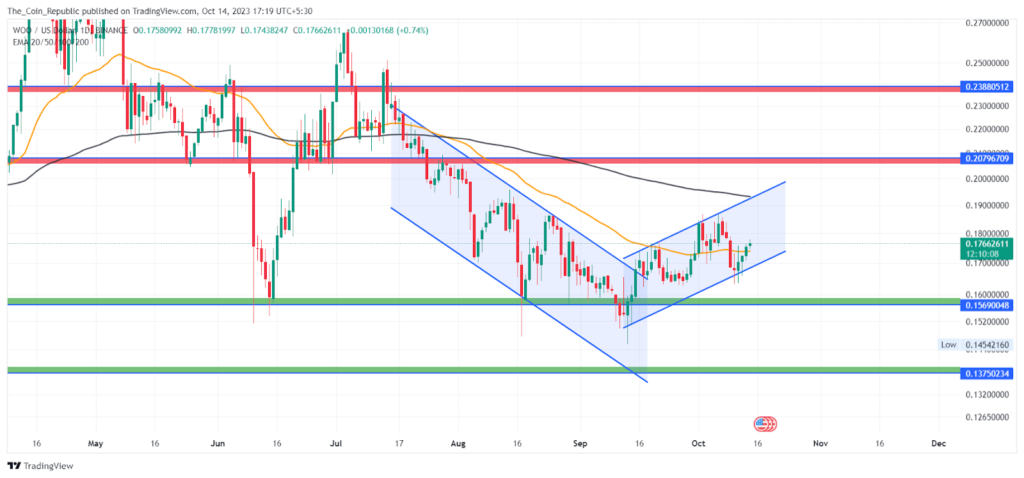
- 1 WOO Network price (WOO) surged 1.53% in the past 24 hours and is currently trading at $0.177.
- 2 WOO crypto price hovers near the 50-day EMA.
- 3 WOO crypto price chart witnesses the formation of an ascending parallel channel pattern over the daily timeframe.
WOO Network price witnesses the formation of an inclining channel pattern over the daily chart with the price taking a rebound from the lower boundary of the channel. The WOO price delivers a bullish outlook in the short term and surpasses the 50-day EMA.
The WOO daily chart analysis elaborates that the crypto price had been in a short-term correction phase; suffering rejections from the 50-day EMA. Moreover, the WOO price respected a declining channel pattern. Recently, the WOO crypto price broke out of the channel near the $0.15 level and turned bullish in the short term.
The volume analysis shows that the WOO Network crypto price has a trading volume of $4.7 Million in the past 24 hours which is 15.66% less than the last day. The crypto has a market cap of $309.8 Million and ranks 95th in the crypto market. The volume-to-market-cap ratio is 1.70% indicating low volatility in the market.
WOO Network Price Forms Rising Channel Pattern
The WOO Network price currently trades at $0.177 with an intraday gain of 1.53%. The WOO price illustrates the formation of an inclined channel pattern with the price respecting the upper and lower boundaries.
The crypto price may show gains to reach the upper boundary of the channel in the coming sessions. The price trend favors the bulls until it is maintained in the channel.
Moreover, the breakdown below the parallel channel pattern might invite more sellers and drag the price to test lower levels.
Technical Indicators Show Neutral To Bullish Trend
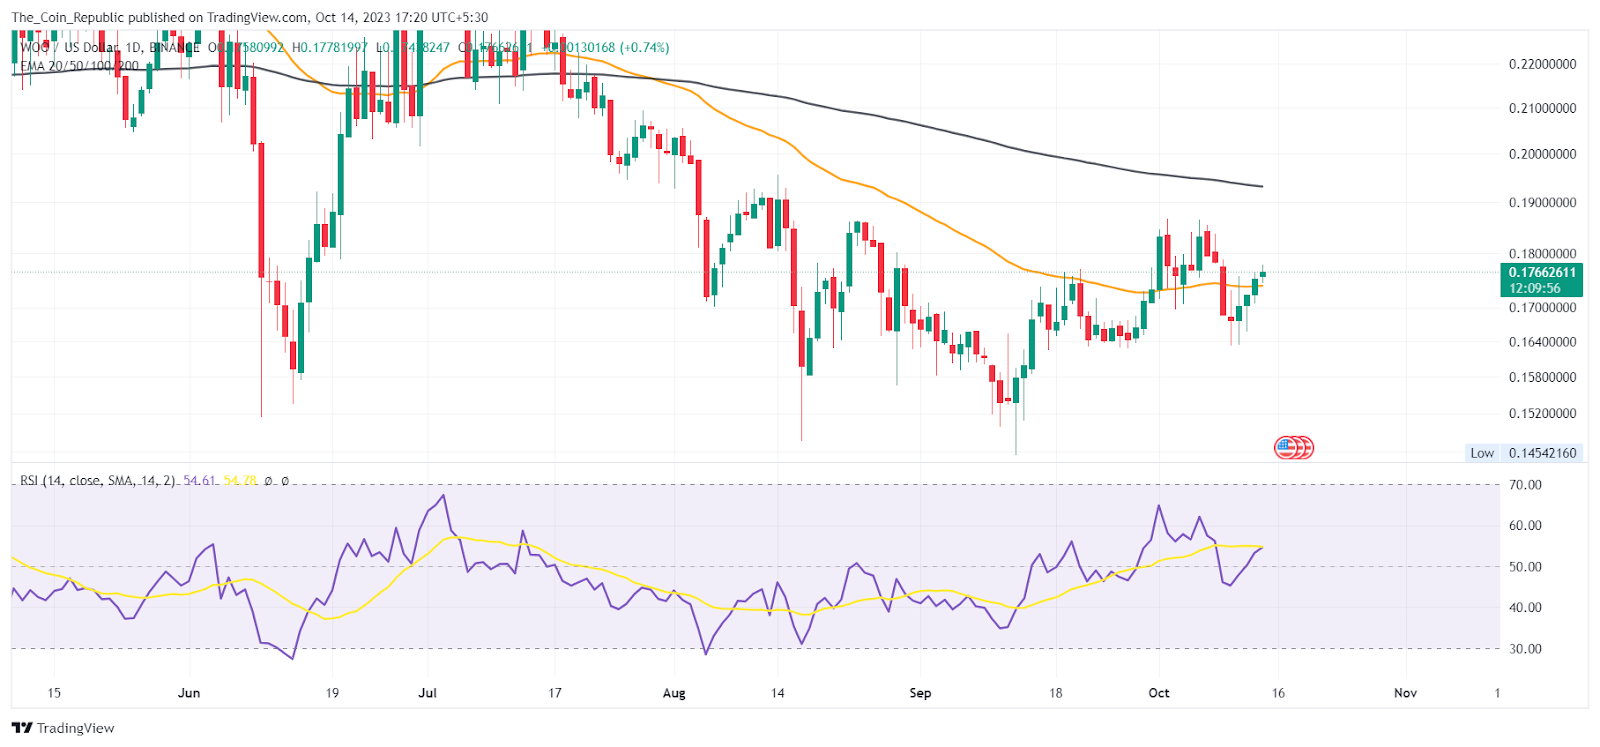
At press time the RSI line and SMA line both hovers above the mean level indicating an optimistic trend prevailing. The RSI is at 57.50 and the SMA line is at 54.70 indicating a bullish crossover of the RSI and SMA line.
The EMA analysis shows that the WOO price surpassed the 50-day EMA indicating bullish dominance in the short term. Also, the 200-day EMA still hovers above the CMP indicating that the price has an upside potential till the 200-day EMA.
Conclusion
The WOO Network price is bullish in the short term as it breaks out of a declining channel and surpasses the 50-day EMA. The price follows an inclined channel pattern and may reach the upper boundary soon. The volume-to-market-cap ratio is low, indicating low volatility.
The RSI and SMA lines are above the mean level, showing a bullish crossover. The 200-day EMA is still above the current price, suggesting more upside potential. The WOO price trades at $0.177 with a 1.53% gain.
Technical Levels
- Support Levels: $0.15 and $0.13
- Resistance Levels: $0.20 and $0.23
Disclaimer
The views and opinions stated by the author, or any people named in this article, are for informational purposes only and do not establish financial, investment, or other advice. Investing in or trading crypto or stock comes with a risk of financial loss.

With a background in journalism, Ritika Sharma has worked with many reputed media firms focusing on general news such as politics and crime. She joined The Coin Republic as a reporter for crypto, and found a great passion for cryptocurrency, Web3, NFTs and other digital assets. She spends a lot of time researching and delving deeper into these concepts around the clock, and is a strong advocate for women in STEM.


