
 Home
Home News
News

- 1 Ethereum crypto price is trading below the key moving averages showcasing bearishness on the daily time frame.
- 2 Ethereum crypto price decreased by 2.96% over the past seven days.
The price action of the Ethereum crypto showed that selling pressure was noted on the charts and was in a downtrend, forming lower lows over the past few months. Moreover, due to declining investor interest, trading volume was below average.

Furthermore, Ethereum showed a decline in user activity which also reacted as a negative sentiment for the crypto and led to bearishness in the charts.

The ongoing trend favors bears, and the crypto was also in a corrective phase, which made buyers cautious. Moreover, Ethereum trades below the significant moving averages and tries to attain the 50-day EMA to hold the gains.
At the time of writing, the Ethereum price is trading at $1585.8 with an intraday gain of 1.79%, showing a bounce from the lower trendline near the support mark of $1532.60. Moreover, the intraday trading volume is 4.529 Billion and the market cap is 190.672 Billion.
ETH Crypto has had a poor performance over the years. However, it gave positive returns of 32.66%, Year-to-date, and negative -24.67% in the span of 6 months. In the last 1 month, it gave a negative return of -3.46% and -2.96% in the last seven days. Indicating a long bearish trend continuing till now.
Technical Analysis of Ethereum Crypto Price in 1-D Timeframe
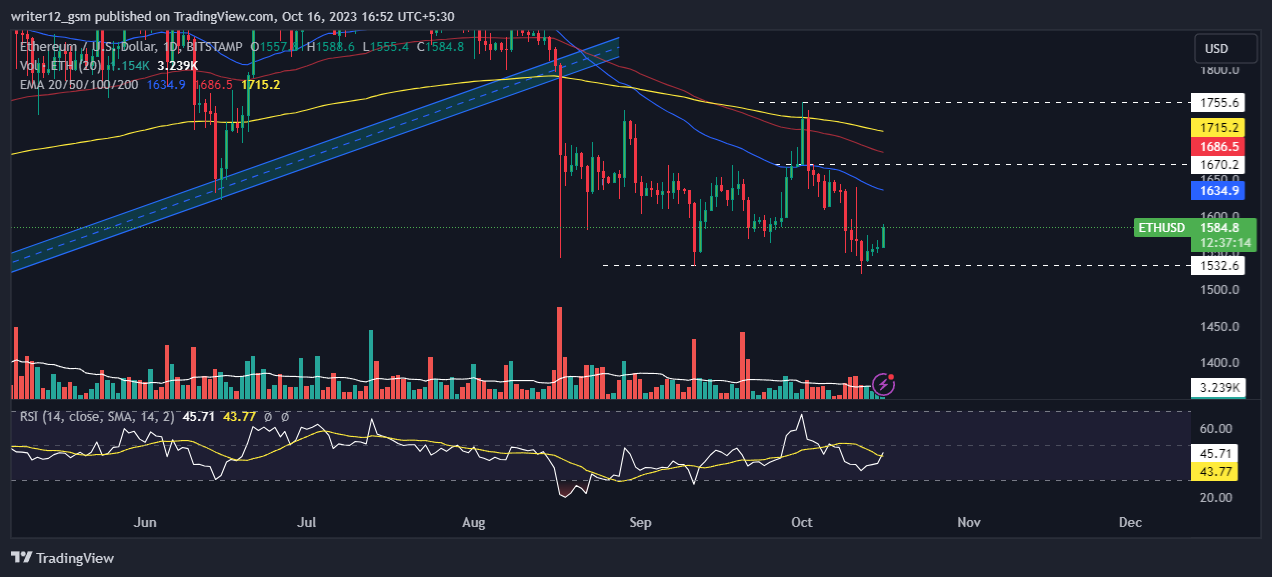
At the time of publishing, Ethereum crypto (USD: ETH) is trading below the 50 and 200-day EMAs (exponential moving averages), which do not support the price trend.
The current value of RSI is 45.73 points. The 14 SMA is near the median line at 43.73 points which indicates that the Ethereum crypto is neutral as of now.
The MACD line at -20.9 and the signal line at -15.7 and are above the zero line. A bearish crossover is observed in the MACD indicator which signals more bearishness for the ETH crypto price.
4-Hour time frame Technical Evaluation Of ETH
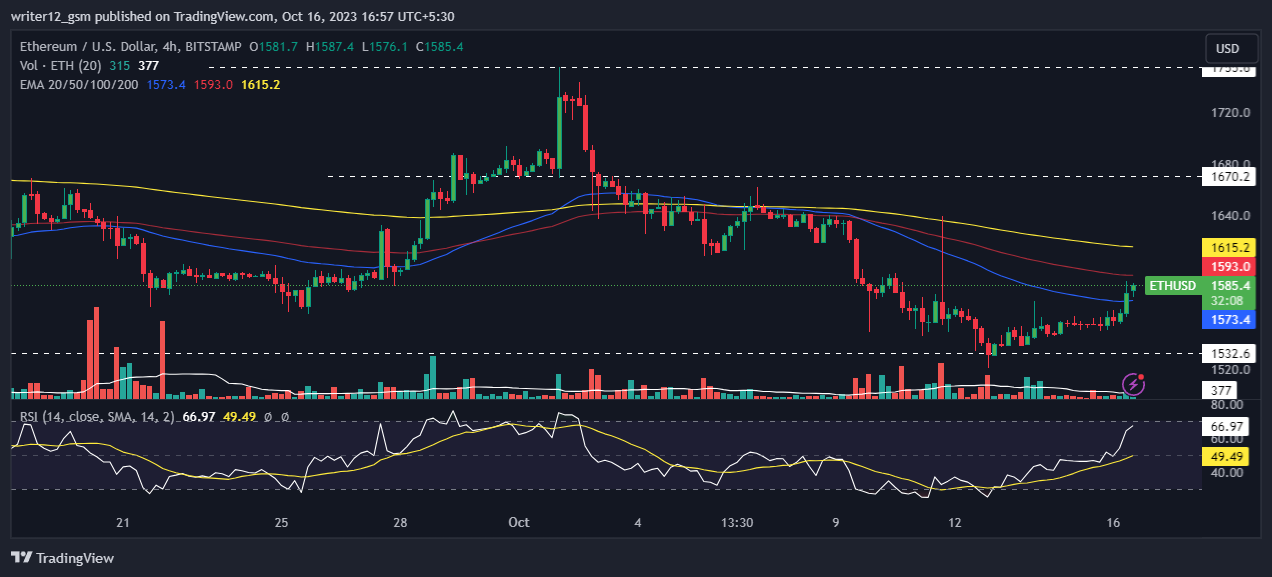
On the 4-hour charts, the Ethereum price is trying to rise above the key moving averages breaking above the 50-day EMA level.
The RSI curve is near 67.02, in the bullish range, and showed a bullish move on the short-term charts. The MACD indicator showed green bars on the histogram with a bullish crossover signaling an upswing.
Summary
Etehereum showing weakness on the daily chart taking support on the level of $1532.60 and again heading towards the 50-day EMA level showing buyers’ presence on the daily chart. However, the direction will turn bullish if the price breaks above the key EMA and sustains over it.
Technical Levels
Support Levels: $1532.6 and $1500.00
Resistance Levels: $1755.6 and $1670.20
Disclaimer
This article is for informational purposes only and does not provide any financial, investment, or other advice. The author or any people mentioned in this article are not responsible for any financial loss that may occur from investing in or trading. Please do your own research before making any financial decisions

Andrew is a blockchain developer who developed his interest in cryptocurrencies while pursuing his post-graduation major in blockchain development. He is a keen observer of details and shares his passion for writing, along with coding. His backend knowledge about blockchain helps him give a unique perspective to his writing skills, and a reliable craft at explaining the concepts such as blockchain programming, languages and token minting. He also frequently shares technical details and performance indicators of ICOs and IDOs.


