
 Home
Home News
News

- 1 PG stock price’s current revenue has increased from last quarter’s revenue but slightly the profit margin swayed down.
- 2 Procter & Gamble Company (NYSE: PG) stock’s 52-week price range is between $135 – $158.
The PG latest quarterly earnings report for the period ending June 2023, displayed a revenue of $20.55 Billion, with a net income of $3.38 Billion, and a profit margin from the last quarter of 16.46%. This quarter, Procter & Gamble reported revenue exceeded analysts’ estimates by $542.564 Million (2.71%).
The PG stock reported an EPS of $1.37 for the period ending June 2023, beating the analysts’ estimate of $1.323 by 3.53%. The PG next quarter’s revenue is estimated to be $21.585 Billion and an estimated EPS of $1.719. The report will be released on October 18th, 2023.
PG stock’s latest quarterly balance sheet for the period ending June 2023 reported total assets of $120.83 Billion and total liabilities of $73.76 Billion. The Procter & Gamble debt-to-assets ratio is at 61.05%.
The PG stock’s dividend yield for the TTM is 2.56% and its last dividend payment was $0.941 per share. The last ex-dividend date was July 20th, 2023 and its payout ratio is 62.41%.
Its dividends are also safe and reliable, as PG stock’s earnings and cash flows support them. PG’s payout ratio is slightly above moderate which is not much of a concern.
PG stock has confidence in its future growth and enough cash flow to invest in its business, as shown by its low dividend payout ratio. Its dividends are also safe and reliable, as its earnings and cash flows support them.
The next dividend for PG stock is $0.94 per share. The ex-dividend date is October 19, 2023, and the payment date is November 15, 2023.
The PG stock’s dividend amount has shown that the company is financially and fundamentally healthy, as it has increased from $2.90 to $3.68 in the past five years.
PG Stock Price Technical Analysis in 1-D Timeframe
The PG stock has a float of 2.355 Billion shares and a market cap of $341.019 Billion. The PG stock has a CMP of $144.69 and an intraday gain of 0.96%. The PG stock’s average volume for the last 10 days is 5.603 Million and its current volume is 7.079 Million.
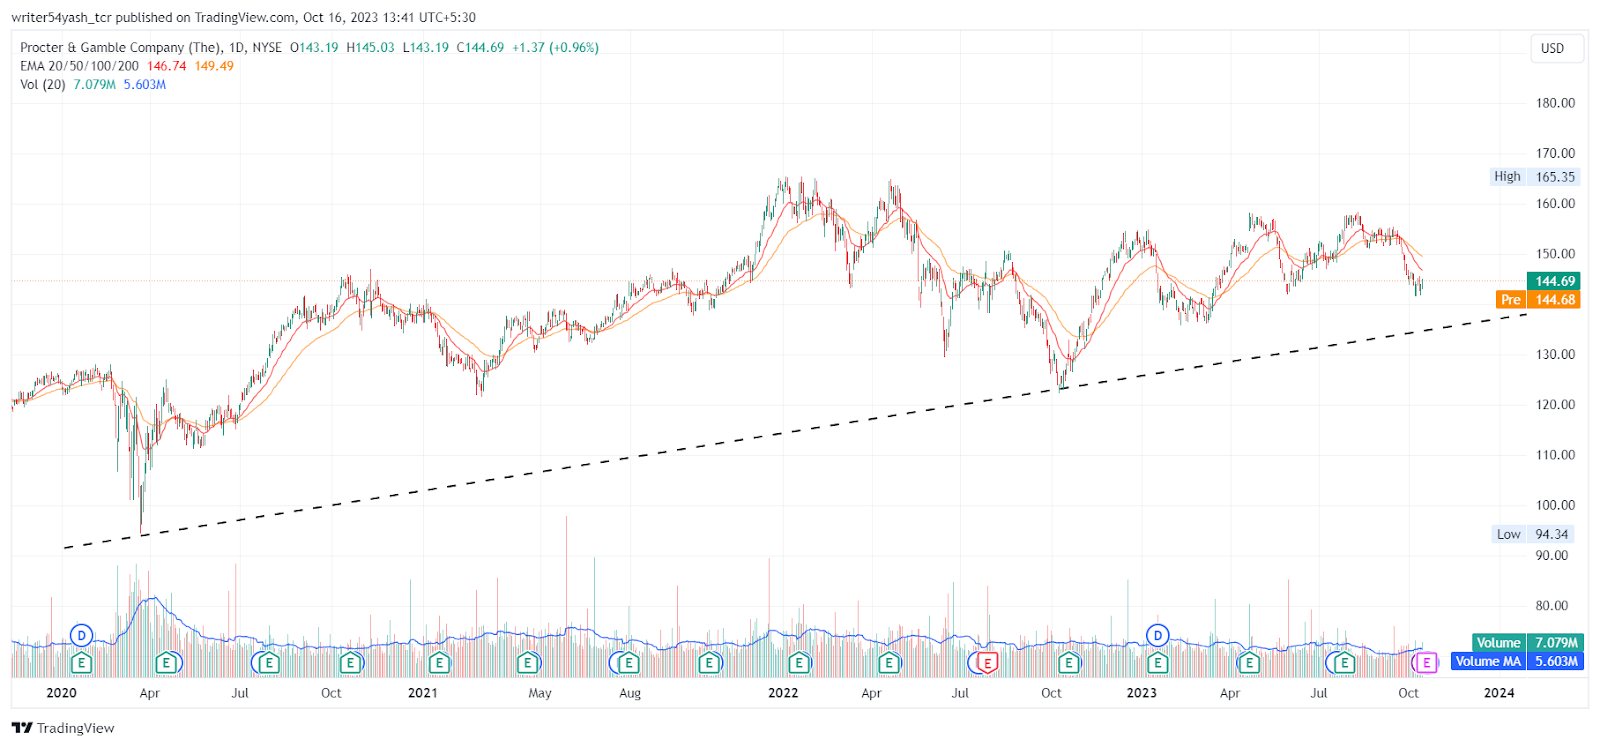
According to Procter & Gamble Company (NYSE: PG), stock price has been on an upward trend since March 2020, when it bounced from the $94 support level. It peaked at $165 in April 2022, breaking through several resistance levels and making higher highs and lows.
However, this trend was interrupted and Procter & Gamble stock price started to decline as investors took profits from the March 2022 quarterly results.
On the other hand, PG stock has shown signs of recovery as it found support at around $141 on October 5th, 2023, and stopped making lower lows and showing its attempt to sustain. Moreover, since 2020, PG stock has been following a rising trendline support.
Therefore, if PG stock can gain strong buying momentum and rise above the previous swing highs, it may make new highs. The possible resistance levels are between $146 and $150.
On the contrary, if Procter & Gamble stock faces resistance again and continues to fall and breaks below $141, it may drop to $138.
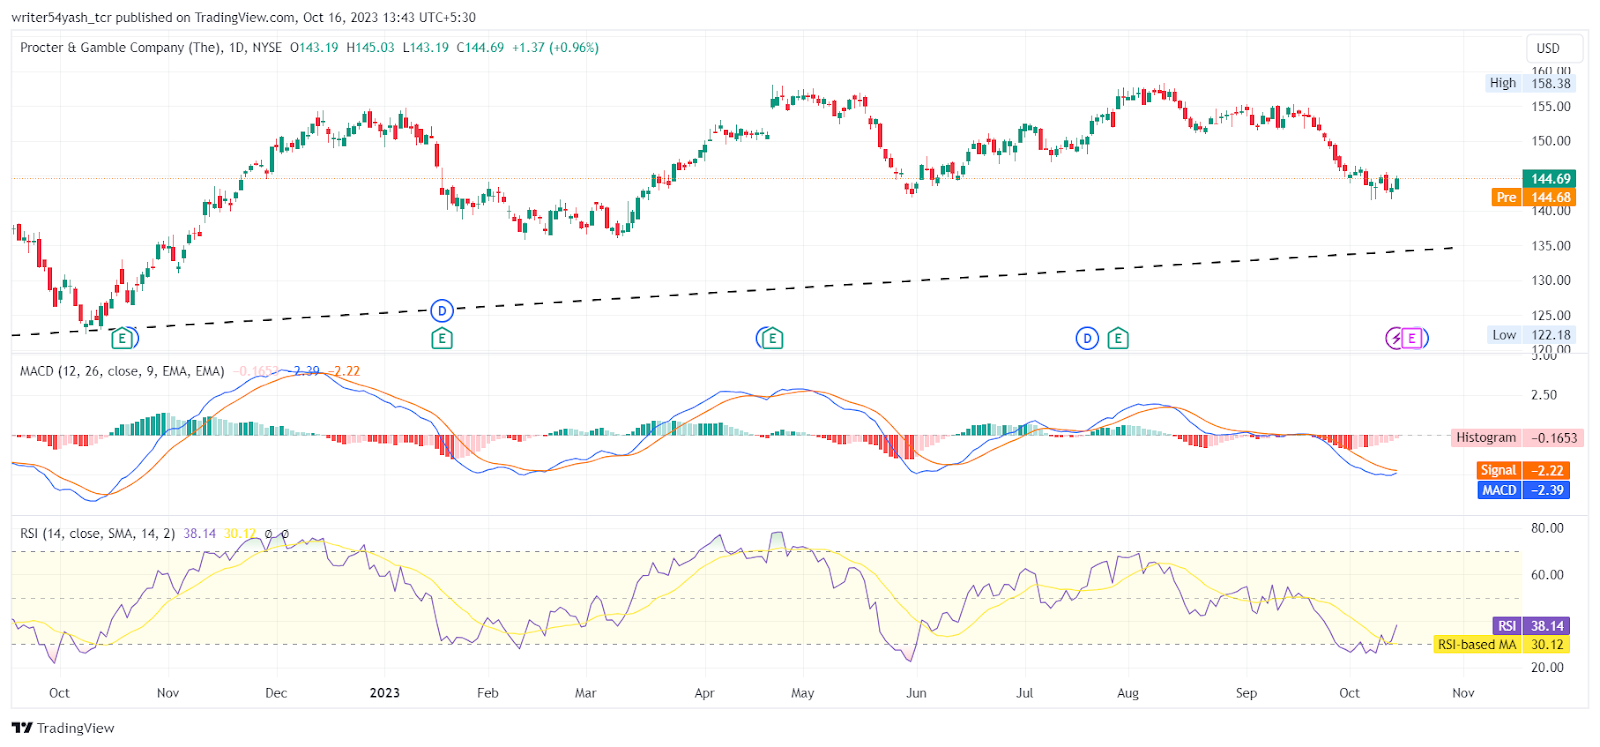
At the time of writing, PG stock is trading below the major 20 and 50 EMAs. But If more buyers enter the market, the stock may overcome the resistance levels and EMAs.
The MACD shows a potential bullish cross as the histogram width is narrow. The RSI is at 38.14 and took support on 14 SMA. The indicators in PG stock suggest bullish signals on the charts.
In addition, the 1-year price forecasts for PG stock by 22 analysts range between $143.00 to $179.00. The stock ratings are positive and highly recommended based on 26 analysts who have evaluated PG stock in the last three months.
Summary
Procter & Gamble Company (NYSE: PG) chart indicates that the traders and investors of the share price are bullish and positive on the 1-D timeframe, based on 26 analysts who have evaluated PG stock in the last three months.
The price action shows a higher highs and lows formation showing signs of a more bullish outlook at the time of publishing. The crucial technical analysis tools of the Procter & Gamble stock price highlight upward signals and support bullishness.
Technical Levels
Support Levels: $141 and $138
Resistance Levels: $146 and $150
Disclaimer
In this article, the views, and opinions stated by the author, or any people named are for informational purposes only, and they don’t establish the investment, financial, or any other advice. Trading or investing in cryptocurrency assets comes with a risk of financial loss.

Nancy J. Allen is a crypto enthusiast, with a major in macroeconomics and minor in business statistics. She believes that cryptocurrencies inspire people to be their own banks, and step aside from traditional monetary exchange systems. She is also intrigued by blockchain technology and its functioning. She frequently researches, and posts content on the top altcoins, their theoretical working principles and technical price predictions.


