
 Home
Home News
News
- 1 Synopsys stock price is currently trading above the key moving averages on the daily timeframe.
- 2 SNPS stock price increased by 7.50% this week.
Synopsys price action indicates bullishness, as SNPS stock keeps the gains on the upper side in the bullish zone and ignores the rejections. The bears are still making short positions and trying to cause a pullback in the stock.
Synopsys Inc. stock displayed bullishness and kept holding the gains above the top. Bulls are accumulating the stock and getting ready to cross $500 in the next sessions.

The chart formation shows the bulls’ momentum and signals a positive outlook on the charts. SNPS stock is aiming to achieve a breakout soon, and investors are watching it closely.
The price action shows a strong chart structure with buyers’ dominance, and long buildup activity was noted in the past trading sessions. Furthermore, sellers were now becoming cautious due to the vertical rally that trapped sellers in the past weeks.
Synopsys’s price was at $489.67 and lost 74.471% of its market capitalization during the day’s trading session. The last 24-hour trading volume was 747.997K and the last 10 days’ average trading volume is 823.594K. This demonstrates that buyers are trying to accumulate in order to surge toward the upper price range.
Technical Analysis of Synopsys Stock Price in 1-D Timeframe
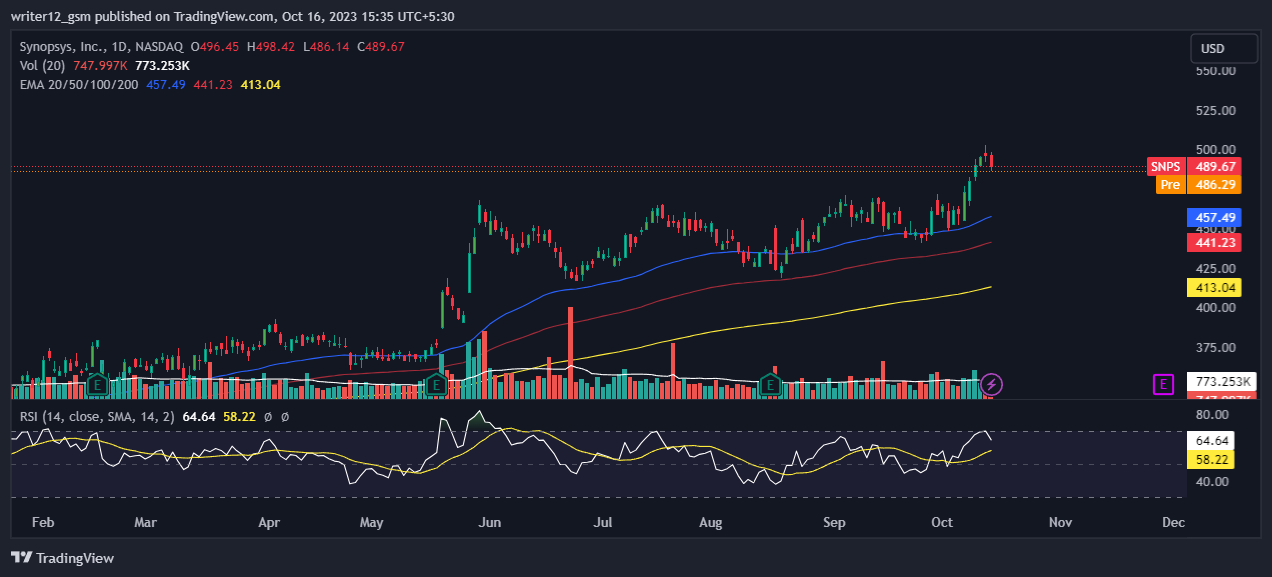
Synopsys Inc. (NASDAQ: SNPS) has steadily seen its stock price rise for the past three months, gaining 8.93% and 8.01% in the last month. Currently, SNPS stock is trading at $489.67 and has been trying to hold on to this level after an unexpected surge in price.
Currently, Synopsys stock (NASDAQ: SNPS) is trading above the 50 and 200-day SMAs (simple moving averages), which are supporting the price momentum.
The current value of RSI is 64.64 points. The 14 SMA is above the median line at 58.22 points, indicating that Synopsys stock is bullish.
The MACD line at 10.33 and the signal line at 6.52 are above the zero line. A bullish crossover is observed in the MACD indicator which signals strength in the momentum of the SNPS stock price.
Weekly-Time Horizon Analysis of SNPS Stock
Synopsys stock has shown buyers’ strength on the weekly charts. Moreover, the price traded above the key EMAs, which shows further strength in the stock. The RSI curve is near the overbought region at 70.23, and a positive outlook was noted, indicating bullishness in the stock. The MACD indicator also persisted to form green bars, and a bullish crossover was noted, which signals bullish moves.
Summary
Synopsys stock (NASDAQ: SNPS) technical oscillators also support the bullish trend. The MACD, RSI, and EMA emphasize positive signs and imply that the uptrend may continue in the SNPS stock price. Price action suggests that the investors and traders are bullish on the 1-Day time frame. The price action reflects a bullish perspective at the moment. However, investors and traders should wait for the proper setup.
Technical Levels
Support Levels: $441 and $413.
Resistance Levels: $500 and $510.
Disclaimer
This article is for informational purposes only and does not provide any financial, investment, or other advice. The author or any people mentioned in this article are not responsible for any financial loss that may occur from investing in or trading. Please do your own research before making any financial decisions

Adarsh Singh is a true connoisseur of Defi and Blockchain technologies, who left his job at a “Big 4” multinational finance firm to pursue crypto and NFT trading full-time. He has a strong background in finance, with MBA from a prestigious B-school. He delves deep into these innovative fields, unraveling their intricacies. Uncovering hidden gems, be it coins, tokens or NFTs, is his expertise. NFTs drive deep interest for him, and his creative analysis of NFTs opens up engaging narratives. He strives to bring decentralized digital assets accessible to the masses.


