
 Home
Home News
News
- 1 ACGL stock price rose 4.64% over the last week and trading above major EMA’s.
- 2 Arch Capital Group Ltd. (NASDAQ: ACGL) stock’s 52-week price range is between $41 – $86.
ACGL stock had total assets of $44.68 Billion and total liabilities of $30.04 Billion in the quarter ending June 2023. This shows that ACGL owed 67.23% of its assets to creditors and other parties.
In the latest quarterly earnings report for the period ending June 2023, ACGL displayed a revenue of $3.09 Billion, with a net income of $671.00 Million, and a profit margin from the last quarter of 21.69%. This quarter, the ACGL stock’s reported revenue exceeded analysts’ estimates by $240.141 Million (7.53%).

Moreover, the ACGL stock reported an EPS of $1.92 for the period ending June 2023, beating the analysts’ estimate of $1.612 by 19.08%. The ACGL next quarter’s revenue is estimated to be $3.249 Billion and the estimated EPS to be $1.612. The report will be released on October 30th, 2023.
ACGL Stock Price Technical Analysis in 1-D Timeframe
The ACGL stock has an intraday gain of 1.83% and has a CMP of $85.70. The ACGL stock’s average volume for the last 10 days is 1.709 Million and its current volume is 2.135 Million. The ACGL stock has a float of 361.352 Million shares and a market cap of $31.962 Billion.
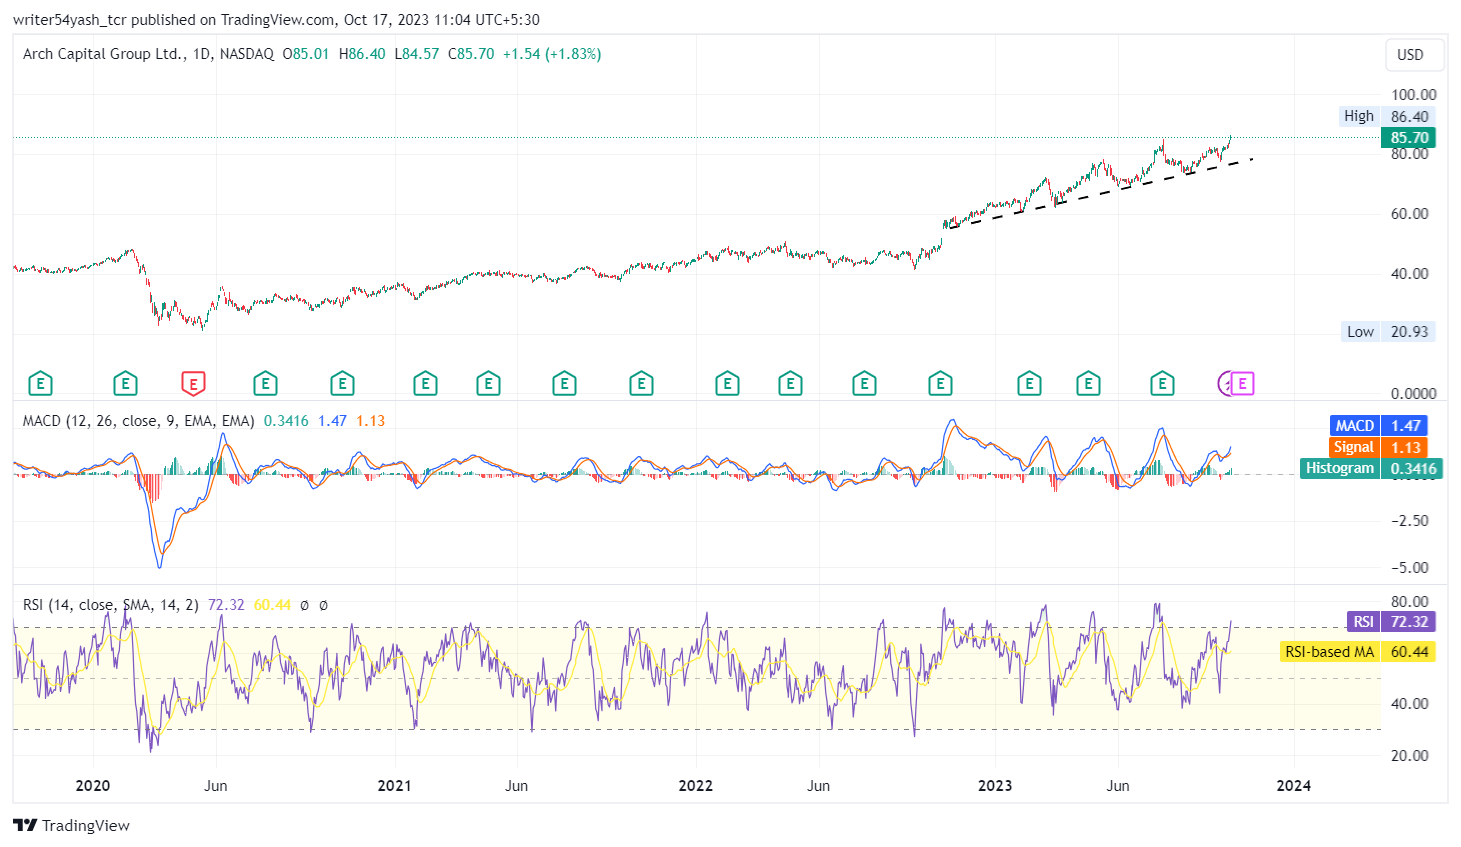
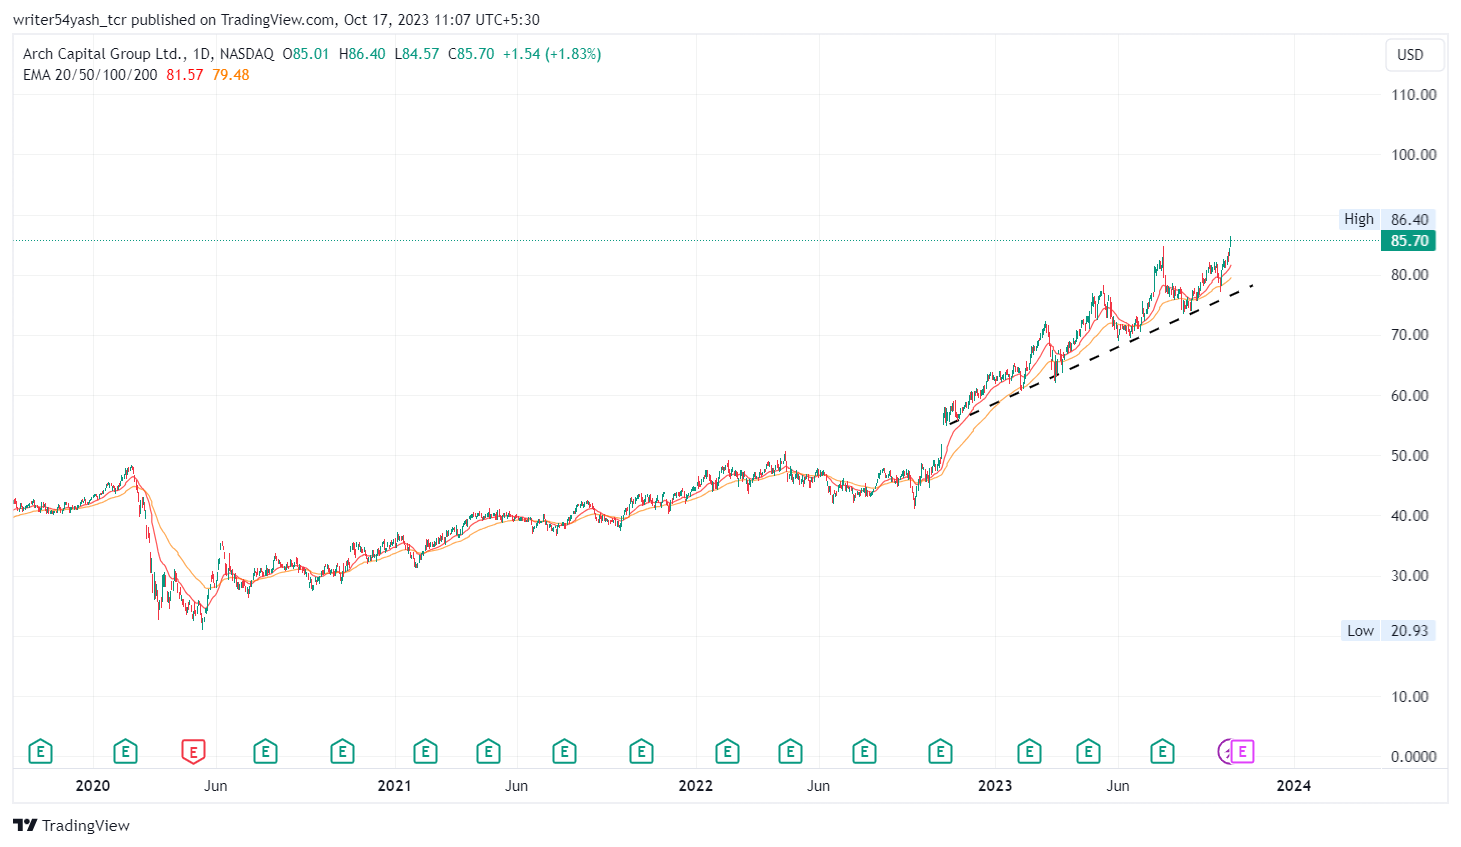
According to Arch Capital Group Ltd. (NASDAQ: ACGL) chart, the stock price has been on an uptrend since March 2020 when ACGL bounced from the $20 support level. It peaked at $86.40 in the last trading session on October 16th, 2023, breaking through several resistance levels and making higher highs and lows and also following the trendline support firmly.
Therefore, if buyers tap into the game, the ACGL stock might surge strongly from the current level and rise above, and it may make new highs. The possible resistance levels or targets range between $90 and $95.
On the contrary, if ACGL loses its grip and continues to fall below and breaks below $80, it may slide to $75.
At the time of writing, ACGL stock is trading above the major 20 and 50 EMAsThe MACD shows a bullish cross. The RSI is at 72.32 and took support on 14 SMA which is at 60.44. The indicators in ACGL stock suggest bullish signals on the charts.
In addition, the stock ratings for ACGL are positive and highly recommended based on 17 analysts who have evaluated the stock in the last three months. The 1-year price forecasts for ACGL stock by 15 analysts range between $79.00 to $103.00.
Summary
The technical analysis tools of the Arch Capital stock price highlight upward signals and support bullishness. Arch Capital Group Ltd. (NASDAQ: ACGL) chart indicates that the traders and investors of the share price are bullish and positive on the 1-D timeframe. The price action shows higher highs and lows formation in ACGL stock shows signs of a bullish outlook at the time of publishing.
Technical Levels
Support Levels: $80 and $75
Resistance Levels: $90 and $95
Disclaimer
In this article, the views, and opinions stated by the author, or any people named are for informational purposes only, and they don’t establish the investment, financial, or any other advice. Trading or investing in cryptocurrency assets comes with a risk of financial loss.
Steve Anderson is an Australian crypto enthusiast. He is a specialist in management and trading for over 5 years. Steve has worked as a crypto trader, he loves learning about decentralisation, understanding the true potential of the blockchain.


