
 Home
Home News
News

- 1 BAC stock price taking rejection from the 50 EMA level, showcasing bearishness.
- 2 Bank of America stock price is under the bears’ hand after a bearish cross on the daily chart.
Bank of America stock price halted near the value from the higher level and since then, it has been on a downtrend throughout the year, as it faced resistance from the higher levels and formed lower lows.
This shows that the sellers have been in control and the stock has lost momentum. The stock has also broken below the key moving averages, which indicates further weakness.

Bank of America stock (NASDAQ: BAC) has returned to its previous breakout level, which could act as a support. Technical analysis suggests that the stock is oversold and could bounce back from the lower levels. However, the stock needs to show signs of strength and reversal before confirming a pullback rally.
Bank of America stock (NASDAQ: BAC) price is in a correction phase but near the crucial support level of $25. If formed, a bearish candle indicates sellers are active and will try their best to rebound from the lower levels.
BAC stock price closed the previous session at $26.99 with an intraday rise of 0.86%. If the buyers succeed in defending the current support, then the possibility of a bounce back will increase. However, if the sell-off continues and Bank of America stock drops below lower levels, more downfall is possible.
Buyers tried multiple times to break the higher range and expand upwards. However, due to the strong presence of sellers, prices faced rejection. It shows sellers are still active on higher levels.
Technical Analysis of Bank of America Stock Price in 1-D Time Frame
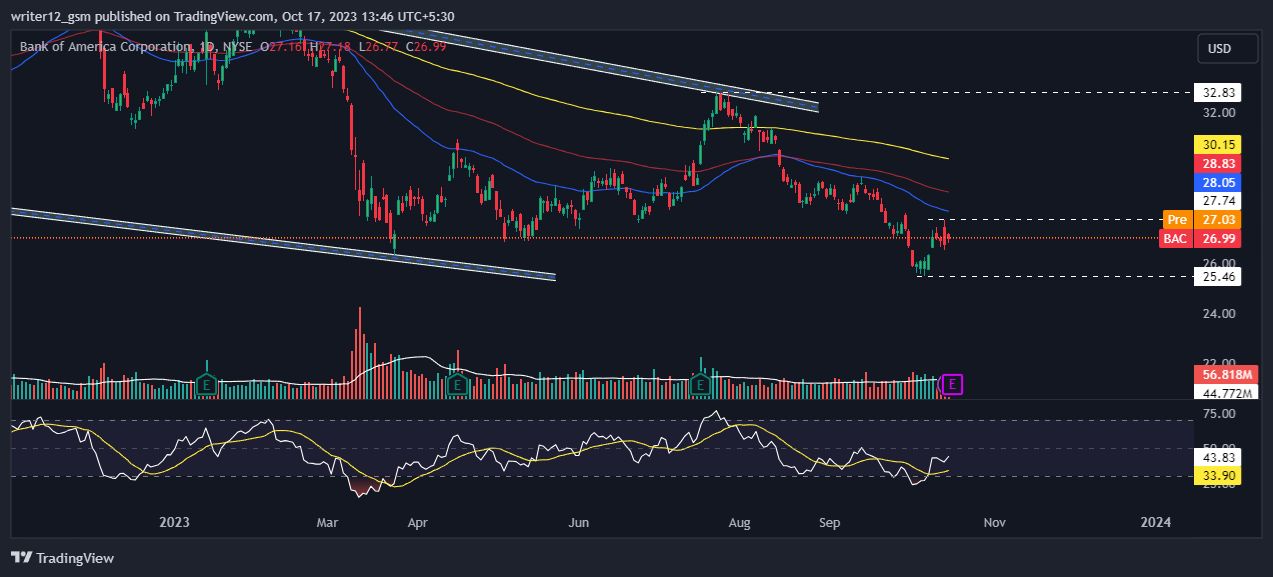
Bank of America price is trading below the downward-sloping 50-day and 200-day EMAs showcasing a downtrend. However, the Bank of America price has gone far away from the EMAs.
The MACD curve generated a positive crossover and the histogram is also green indicating bearishness. The current value of RSI is 43.83 points. The 14 SMA is below the median line at 33.90 points, indicating that the Bank of America stock price is bearish.
Weekly-Time Horizon Analysis: BAC Stock
Bank of America stock has shown sellers’ strength on the weekly chart. Moreover, the price is below the key EMAs, which shows further weakness in the stock. The RSI curve is near the oversold region at 40. A negative outlook was noted, indicating bearishness in the stock. The MACD persisted to form red bars, and a bearish crossover was noted, which signals bearish moves on the daily chart.
Summary
BAC stock is trying hard to breach the higher levels and break the key EMAs but failed in their attempts. The main hurdle for the BAC stock to start a bullish momentum right now is 50, 100, and 200 EMAs spelling trouble for the stock. However, the buyers attempted multiple times to break the higher levels but sellers are overpowering buyers as of now.
Technical Levels
Support Levels: $25.46 and $22.98
Resistance Levels: $27.74 and $30.15
Disclaimer
This article is for informational purposes only and does not provide any financial, investment, or other advice. The author or any people mentioned in this article are not responsible for any financial loss that may occur from investing in or trading. Please do your own research before making any financial decisions.
Steve Anderson is an Australian crypto enthusiast. He is a specialist in management and trading for over 5 years. Steve has worked as a crypto trader, he loves learning about decentralisation, understanding the true potential of the blockchain.


