
 Home
Home News
News
- 1 SNAP stock price gained 11.98% in intraday in the last session and closed at $9.72.
- 2 Snap Inc. stock (NYSE: SNAP) price broke out of a 30-day consolidation period.
- 3 The company is yet to announce its third quarterly results on Tuesday, 24th October.
Snap Inc. (SNAP) stock price lifted 11.98% on Monday and started the week with a very bullish outlook. The Snap stock price witnessed a gap-up opening of almost 4% followed by a surge of 7% by the end of Monday’s session, thus, gaining about 12%.
The intraday gain has turned the pre-earning sentiments on the bullish side. Moreover, the daily chart illustrates that the stock price has broken out of a 28-day consolidation near the recent swing low. The breakout has confirmed the base formation and presence of bulls near the lows.
Snap Inc. is yet to announce its third quarterly results on Tuesday, 24th October which may affect the price trend. The Wall Street analysts are estimating Snap Inc. to show a revenue of $1.11 Billion and earnings of negative $0.241 Billion.
The analysts offering a 1-year price forecast for Snap stock estimate a maximum potential of 54.32% that could take the price to a high of $15. Also, the bearish side of the analysts expect a drawdown of over 33.13% that could drag the price to a low of $6.50.
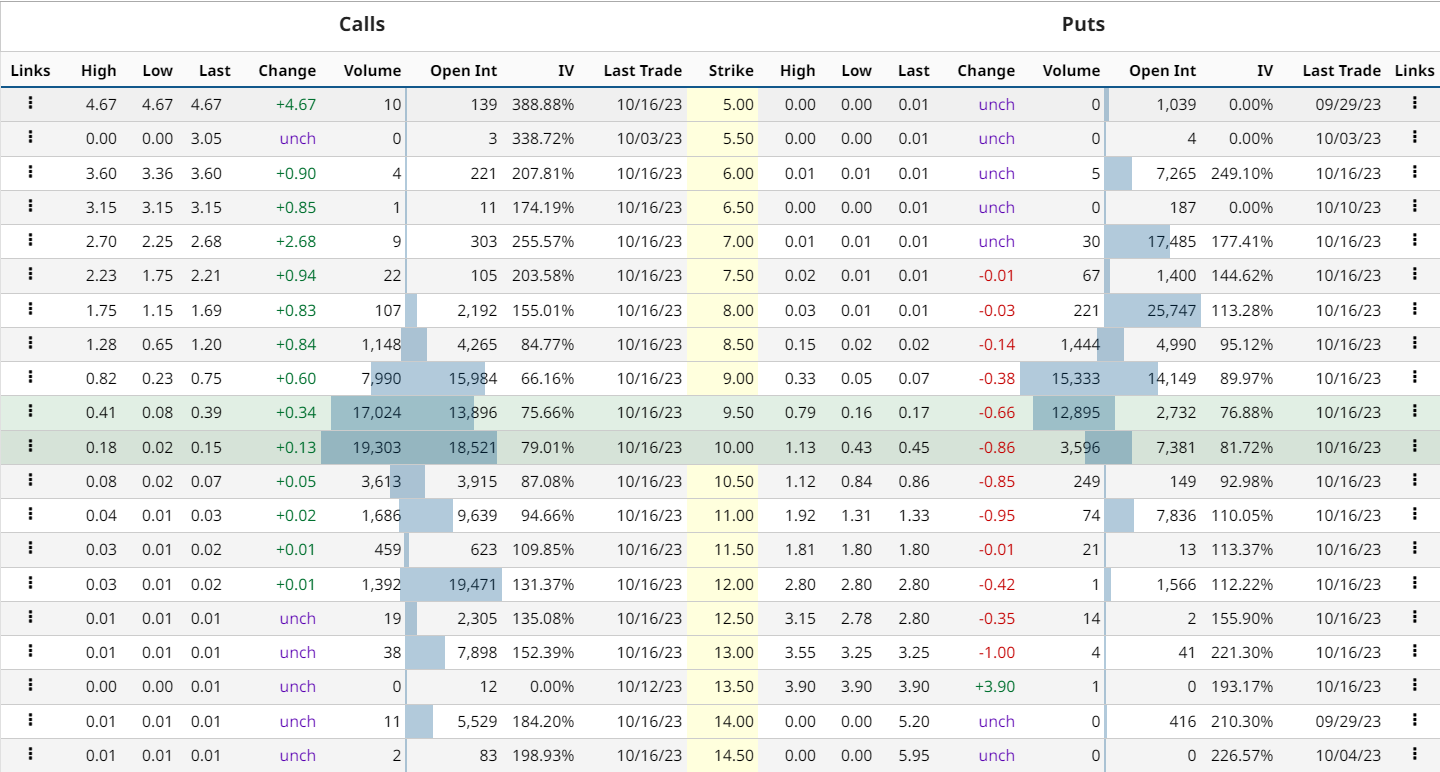
SNAP stock option-chain analysis states that the current implied volatility in the market is 99.22% with a decrement of 2.19% in the last trading session. The at-the-money strike has an OI of 2,372 on the PUT side and 13,896 on the CALL side indicating the domination of buyers at the CMP.
SNAP Stock Price Shows Breakout of Consolidation
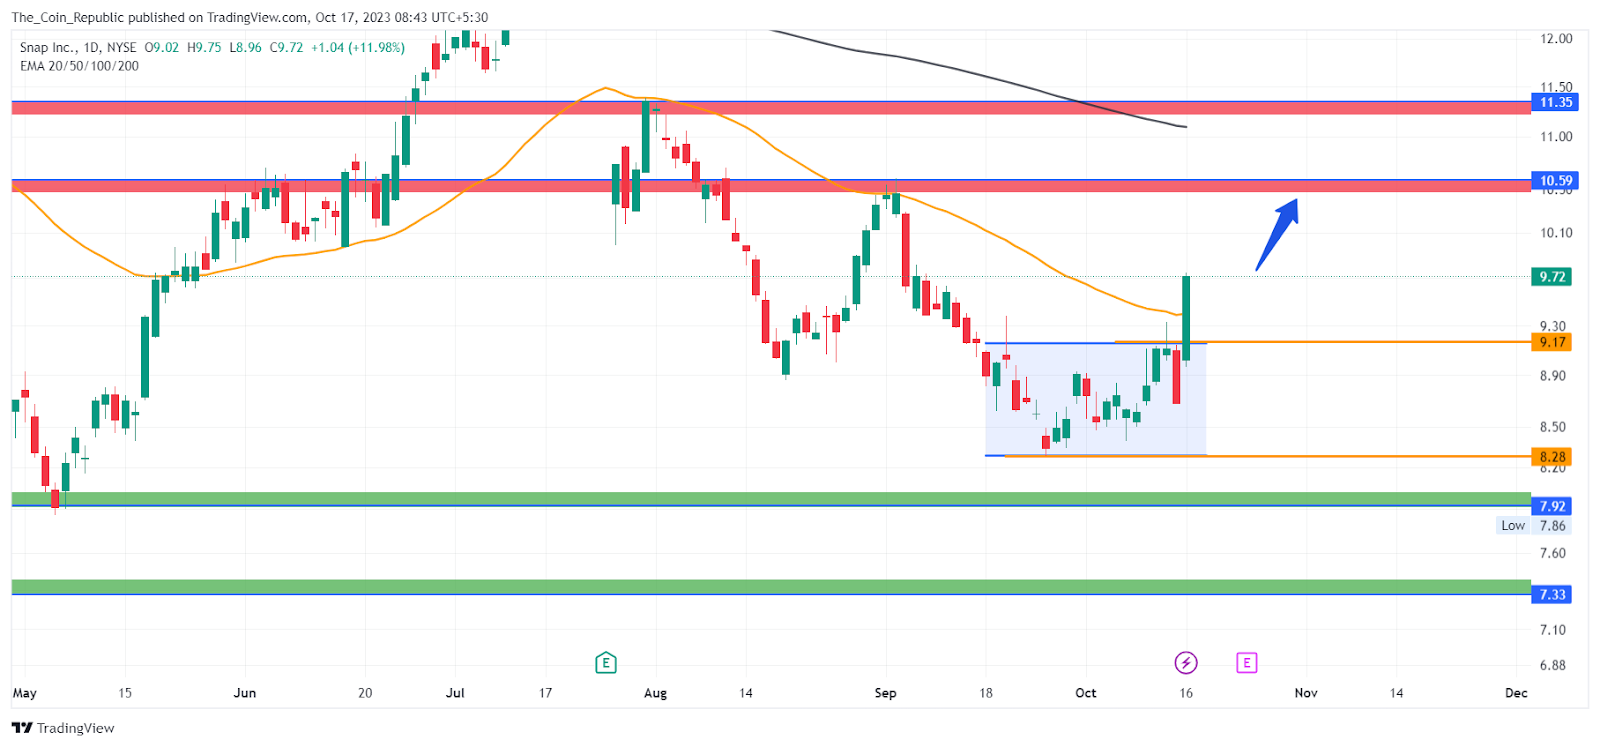
The Snap stock price currently trades at $9.72 with an intraday gain of 11.98% on Monday. The stock price has recently made a breakout of the consolidation phase, thus, turning pre-earnings sentiments positive.
The stock price made a breakout of the 50-day EMA and may continue to gain in the upcoming sessions to reach the 200-day EMA.
Technical Indicators Show Optimistic Trend in the Short Term
The daily SNAP stock price chart shows that the price has surpassed the 50-day EMA with a strong candle indicating the bullishness in the short term. At press time, the RSI lines are showing a positive crossover indicating strength.
The overall technical opinion rating including RSI and MACD signals a 48% “sell” with the weakening short-term outlook on maintaining the current direction.
Conclusion
Snap Inc. (SNAP) stock price soared 12% on Monday, breaking out of a 28-day consolidation near the recent low. The bullish move came before the third-quarter earnings report, which is expected on Tuesday, 24th October. Analysts predict revenue of $1.11 Billion and earnings of negative $0.241 Billion for Snap. The stock price could reach a high of $15 or a low of $6.50 in the next year, according to analysts. The stock price is currently at $9.72 and has crossed the 50-day EMA, indicating a positive trend.
Technical Levels
- Support levels: $8.28 and $7.92
- Resistance levels: $10.59 and $11.35
Disclaimer
The views and opinions stated by the author, or any people named in this article, are for informational purposes only and do not establish financial, investment, or other advice. Investing in or trading crypto or stock comes with a risk of financial loss.
Steve Anderson is an Australian crypto enthusiast. He is a specialist in management and trading for over 5 years. Steve has worked as a crypto trader, he loves learning about decentralisation, understanding the true potential of the blockchain.


