
 Home
Home News
News

- 1 UNI token price has persisted in losing the gains.
- 2 Buyers failed to halt the gains and were in trouble.
Uniswap (UNI) token price is below the significant moving averages and has showcased a downtrend for the past sessions. Moreover, the price action shows that UNI token price was inside the falling parallel channel and has persisted in forming lower lows, meaning buyers were unable to arrest the selling pressure. Additionally, sellers have persisted in gaining traction and have continued to put pressure on the bulls results in correction in the past sessions.

Uniswap token chart shows a rising channel. It reached the supply zone of $6.50, but failed to surpass it. Afterwards, bears charged their muscles and broke down near $6.00 with anic selloff witnessed in the past weeks. Thereafter, bulls could not manage to absorb the selloff and sellers continued to dominate and pushed UNI back to its origin which was witnessed on the charts. Furthermore, the chart shows the rejection candlestick near the crucial zone which shows that buyers did not have enough momentum to surpass the resistance zone and still hovers below the 20 day EMA in the past sessions.

At press time, UNI token price is trading at $4.032 with an intraday drop of 2.11% showing bearishness on the charts. Moreover, the trading volume increased by 2.11% to $56.85 Million and the pair of UNI/BTC is at 0.000142 BTC. However, analysts maintained a sell rating and suggest a negative view based on the technicals.
Will UNI Continue to Drag Gains or Hold $4.00?
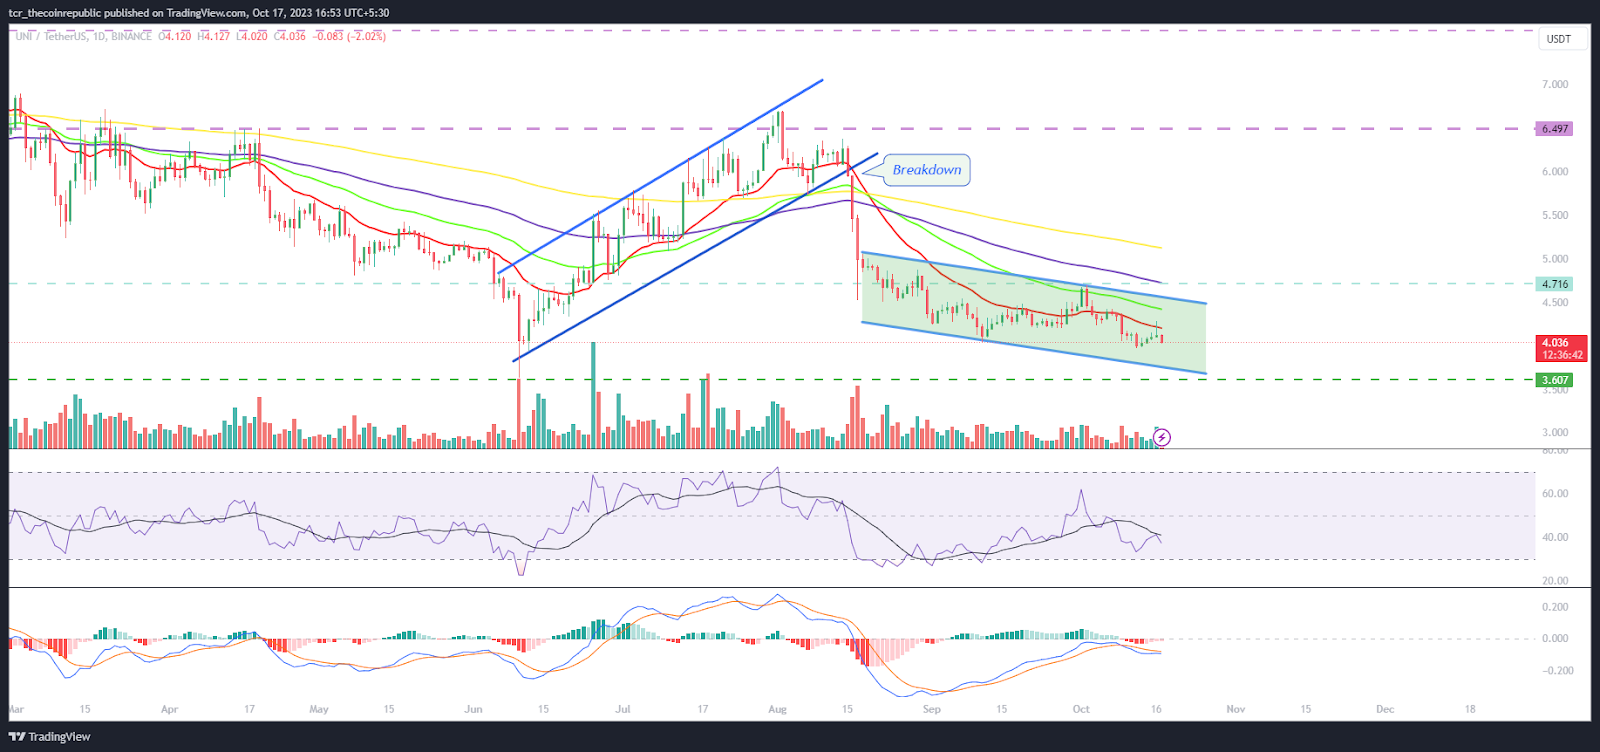
On the daily charts, UNI token price is trading below the 20 day EMA showing a downtrend in the past sessions. Moreover, the chart shows a falling parallel channel. UNI token persisted in dragging the gains, losing the initial momentum amid the rise in crypto market.
Furthermore, UNI token price has dragged below the 23.6% Fibonacci retracement level and showed bearishness on the charts. Moreover, the contraction of the bollinger band suggests further selling pressure will continue and UNI price may drag toward $3.30 in the next sessions.
The RSI curve stayed in the oversold region and showed a bearish divergence forming a negative crossover.
The MACD indicator shows a bearish crossover and red bars on the histogram suggesting a negative outlook for the upcoming sessions.
Summary
Uniswap token price was in a downtrend and showcased seller dominance in past sessions. Moreover, the price action highlights lower lows and indicates that UNI price faced rejection near the 20 day EMA barrier and formed an inverted hammer candlestick which suggests that further correction may expand toward $3.80.
Technical Levels
Support Levels: $3.90 and $3.70
Resistance Levels: $4.20 and $4.50
Disclaimer
The views and opinions stated by the author or any other person named in this article are for informational purposes only and do not constitute financial, investment, or other advice. Investing in or trading crypto or stocks comes with a risk of financial loss.
Mr. Pratik chadhokar is an Indian Forex, Cryptocurrencies and Financial Market Advisor and analyst with a background in IT and Financial market Strategist. He specialises in market strategies and technical analysis and has spent over a year as a financial markets contributor and observer. He possesses strong technical analytical skills and is well known for his entertaining and informative analysis of the Financial markets.


