
 Home
Home News
News
- 1 NEAR price prediction shows that NEAR crypto is trading at a crucial make-or-break zone.
- 2 NEAR crypto price slipped below 20, 50, 100 and 200-days daily moving averages.
- 3 Near Protocol cryptocurrency slipped by 19.79% year to date.
NEAR price prediction shows the fall of the cryptocurrency inside an interesting declining pattern over the daily time frame chart. Meanwhile, NEAR crypto has been trying to sustain at the lower trendline of the descending triangle pattern which is basically the make-or-break situation for NEAR crypto. Buyers need to come forward for the rescue of NEAR crypto.
At present, sellers are trying to pull NEAR from the lower trendline of the descending triangle pattern. This shows the higher accumulation by sellers intraday.

NEAR price was at $1.002 and lost 0.99% of its market capitalization during the day trading session. Trading volume declined by 24.88% during the intraday trading session. This demonstrates that sellers are trying to pull NEAR down from the current position. Volume to market cap ratio was at 25.96%.
Will NEAR Price Escape From This Pattern?
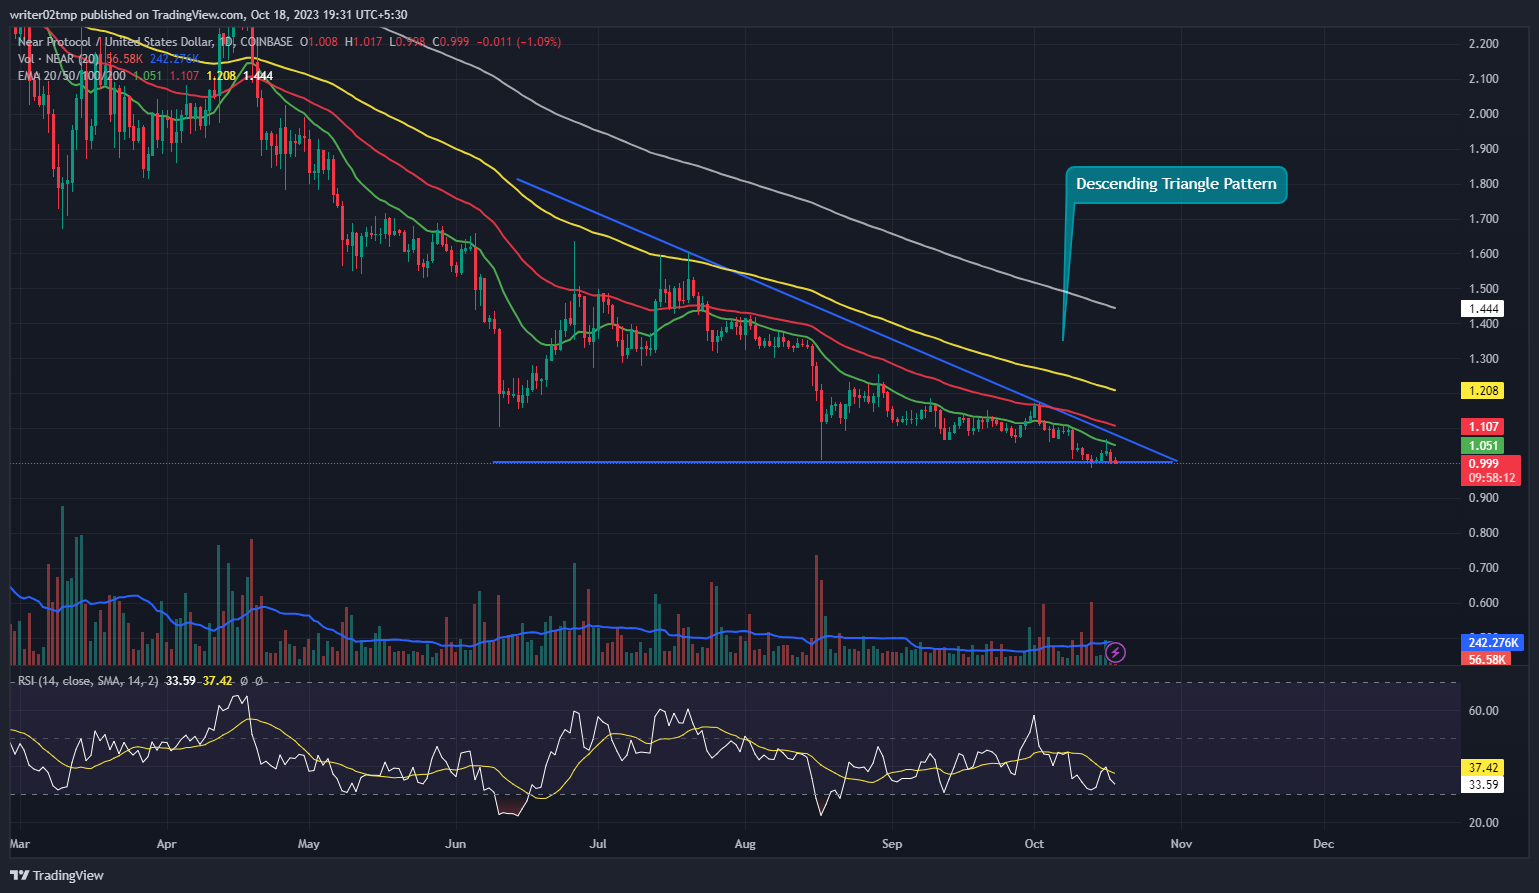
NEAR price prediction highlights the consolidation phase of NEAR inside the descending triangle pattern. Buyers need to accumulate at a higher rate in order to push NEAR above from the lower trendline of the descending triangle pattern. However, volume change is below average and needs to grow intraday. Meanwhile, NEAR crypto price slipped below 20, 50, 100 and 200-days daily moving averages.
NEAR cryptocurrency faced a 3.74% weekly drop and an 8.22% decline over the past month. Over a three-month period, NEAR has recorded a significant 31.59% loss, extending to a substantial 50.83% drop over six months. Year-to-date, NEAR crypto’s price fell by approximately 19.79%.
Technical indicators highlight the downtrend on the NEAR crypto chart. Relative strength index (RSI) confirms the fall of NEAR crypto. RSI was at 33 and is heading towards the oversold territory. Investors in NEAR cryptocurrency need to wait for any directional change over the daily time frame chart.
Summary
NEAR price prediction shows the fall of the cryptocurrency inside an interesting declining pattern over the daily time frame chart. Buyers need to accumulate at a higher rate in order to push NEAR above from the lower trendline of the descending triangle pattern. Year-to-date, NEAR crypto price fell by approximately 19.79%. Technical indicators highlight the downtrend on the NEAR crypto chart. Investors in NEAR cryptocurrency need to wait for any directional change over the daily time frame chart.
Technical Levels
Support Levels: $0.991 and $0.989
Resistance Levels: $1.072 and $1.105
Disclaimer
The views and opinions stated by the author, or any people named in this article, are for informational purposes only, and they do not establish financial, investment, or other advice. Investing in or trading crypto or stock comes with a risk of financial loss.

Adarsh Singh is a true connoisseur of Defi and Blockchain technologies, who left his job at a “Big 4” multinational finance firm to pursue crypto and NFT trading full-time. He has a strong background in finance, with MBA from a prestigious B-school. He delves deep into these innovative fields, unraveling their intricacies. Uncovering hidden gems, be it coins, tokens or NFTs, is his expertise. NFTs drive deep interest for him, and his creative analysis of NFTs opens up engaging narratives. He strives to bring decentralized digital assets accessible to the masses.


