
 Home
Home News
News
- 1 Quant price prediction indicates that QNT crypto is on a steady decline.
- 2 QNT crypto is currently trying to sustain at 20-EMA to surge above 50, 100 and 200-days daily moving averages.
- 3 Quant cryptocurrency has declined by 17.98% year to date.
Quant price prediction highlights the fall of QNT crypto inside an interesting pattern over the daily time frame chart. Meanwhile, QNT crypto has been declining through the descending parallel channel since April 2023. Buyers tried to accumulate for QNT crypto’s breakout but failed to sustain at the upper trendline of the descending parallel channel.
However, QNT crypto is currently trying to sustain at 20-EMA to surge above 50, 100 and 200-days daily moving averages. Quant crypto price has been trying to recover from the declining pattern but failed to sustain. If it sustains at the 20-EMA line, then it may surge sharply, as per analysts.

Quant price was at $86.18 and gained slightly around 0.49% of its market capitalization intraday. However, trading volume decreased by 11.54% during the intraday trading session. This demonstrates that sellers are already in the process of pulling QNT down. Volume to market cap ratio was at 0.98%.
Will Quant Price Sustain or Get Detained?
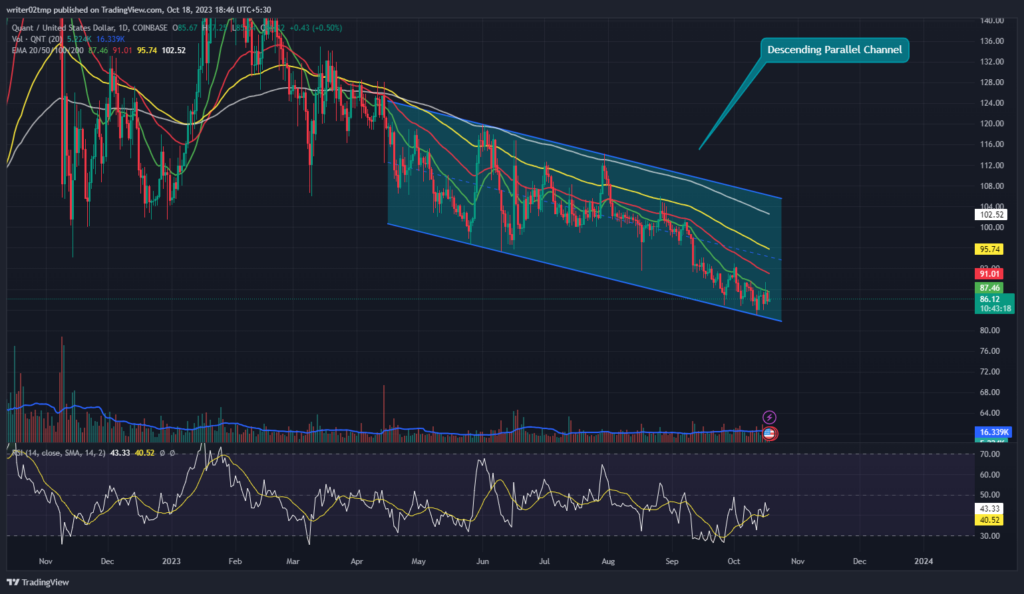
Quant price prediction showcasing the downfall of QNT crypto through the descending parallel channel over the daily time frame chart. Buyers need to accumulate at a higher rate in order to push QNT upwards. However, volume change is lower than the usual which signifies the fall of QNT crypto. Meanwhile, QNT crypto is currently trying to sustain at 20-EMA to surge above 50, 100 and 200-days daily moving averages.
Quant crypto posted a modest weekly gain of 0.64%, but the monthly performance wasn’t as favorable, with a decline of 5.16%. Over a three-month period, QNT recorded a significant loss of 14.16%, extending to 21.60% over six months. Year-to-date, Quant crypto price fell by about 17.98%.
Technical indicators highlight sustainability issues for QNT crypto inside the descending parallel channel pattern. Relative strength index (RSI) indicates the upside trend of QNT crypto. RSI was at 43 and is moving towards neutrality. Investors in Quant cryptocurrency need to wait for any directional change over the daily time frame chart.
Summary
Quant price prediction highlights the fall of QNT crypto inside an interesting pattern over the daily time frame chart. Quant crypto price has been trying to recover from the declining pattern but failed to sustain. Volume change is lower than the usual. Technical indicators highlight sustainability issues of QNT crypto inside the descending parallel channel pattern. Investors in Quant cryptocurrency need to wait for any directional change over the daily time frame chart.
Technical Levels
Support Levels: $84.84 and $83.10
Resistance Levels: $89.35 and $92.20
Disclaimer
The views and opinions stated by the author, or any people named in this article, are for informational purposes only, and they do not establish financial, investment, or other advice. Investing in or trading crypto or stock comes with a risk of financial loss.
Steve Anderson is an Australian crypto enthusiast. He is a specialist in management and trading for over 5 years. Steve has worked as a crypto trader, he loves learning about decentralisation, understanding the true potential of the blockchain.


