
 Home
Home News
News
- 1 RNDR token price has showcased a reversal from the demand zone of $1.30.
- 2 Buyers have begun to accumulate.
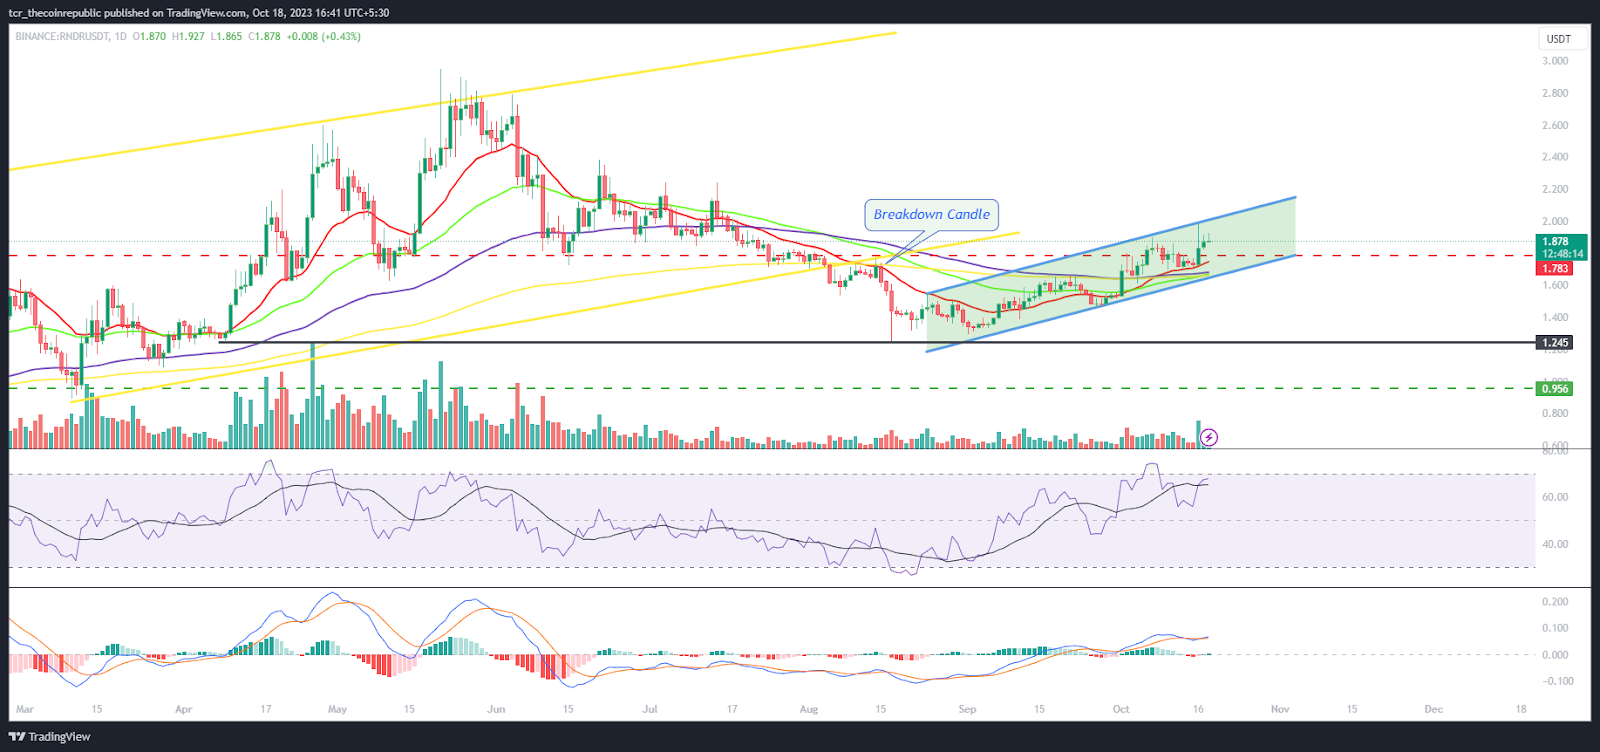
Render token price showed a reversal and started a fresh up move inside the rising parallel channel indicating the buyer interest. Moreover, the price action shows that buyers have started gaining traction and are looking to trap the bears. RNDR token has surpassed the 20 day EMA hurdle and is gaining momentum. Furthermore, RNDR token price has reached the resistance zone of $1.90. Buyers will look to escape the $1.9 level to sustain above the 20 day EMA for further extension of reversal.
Render token price has shown correction in the past few sessions and has retested the demand zone of $1.30 near the 38.2% Fibonacci retracement zone, where sellers failed. Since then, fresh buying momentum leads to a reversal which is still in action and has more to come. Furthermore, the price action shows that after the correction, bulls were trying to recover the gains and are looking to retain the immediate swing & round mark of $2.00.
At press time, RNDR token price is trading at $1.880 with an intraday gain of 1.54% showing neutrality on the charts. Moreover, the trading volume increased by 2.90% to $55.11 Million and the pair of RNDR/BTC is at 0.0000663 BTC. However, the market cap of RNDR token is $1.01 Billion. Furthermore, analysts maintained a neutral outlook and suggest that RNDR may pick up pace in the upcoming sessions.
Will RNDR Token Extend Recovery Phase to $2.00?
On the daily charts, RNDR token price is above the significant moving averages, suggesting that bulls could lead the stock to the $2.00 level. Furthermore, RNDR token is heading to reach the 50% Fib zone which if surpassed, fresh up move will start and more glimpse of bullishness can be anticipated.
The RSI curve stayed in the overbought zone and showed a positive crossover indicating that buyers showed their interest and are trying to continue the reversal for the next sessions.
The MACD indicator showed a bullish crossover and green bars on the histogram suggesting a positive outlook for the coming sessions.
Summary
RNDR token price surpassed the 20 day EMA barrier, extending the reversal inside the rising parallel channel. Furthermore, the price action suggests that follow-on buying will continue and RNDR token is likely to retest the immediate round mark of $2.00.
Technical Levels
Support Levels: $1.70 and $1.50
Resistance Levels: $2.00 and $2.30
Disclaimer
The views and opinions stated by the author or any other person named in this article are for informational purposes only and do not constitute financial, investment, or other advice. Investing in or trading crypto or stocks comes with a risk of financial loss.
Mr. Pratik chadhokar is an Indian Forex, Cryptocurrencies and Financial Market Advisor and analyst with a background in IT and Financial market Strategist. He specialises in market strategies and technical analysis and has spent over a year as a financial markets contributor and observer. He possesses strong technical analytical skills and is well known for his entertaining and informative analysis of the Financial markets.


