
 Home
Home News
News

- 1 The HON stock showcases bullishness on the daily time frame.
- 2 Honeywell International Inc. (NASDAQ: HON) stock’s revenue and profit margin increased since last quarter.
HON stock is currently trading at the level of $183.47 with an intraday loss of 1.53% which showcases that bears are trying to overpower the bulls. But it seems a difficult job for bears right now as the bulls do not want to slip the momentum from their grasp so easily.
HON stock is currently trading with an intraday volume of 2.262 Million and the average trading volume of the stock is 2.642 Million. The market cap of the company is $121.817 Billion and the number of floating shares in the market is 663.381 Million shares.

Based on price action, the HON stock price has been rising since March 2020, when HON rallied from the $101 support level by making higher highs and lows and reaching $236 in July 2021. But at a high, it faced resistance as investors took profit booking, and it stayed below the trendline.
However, the stock has shown an improvement sign as the HON price took support at a level of around $180 on the charts in the starting week of October 2023.
Therefore, if buyers boost more, the HON stock might surge strongly from the current level and surge above. The possible targets are between $195 and $200.From the alternative perspective, if HON stock fails to hold on and continuously declines and breaches below $180, it may hit $170.
What Chart Says About HON Price?
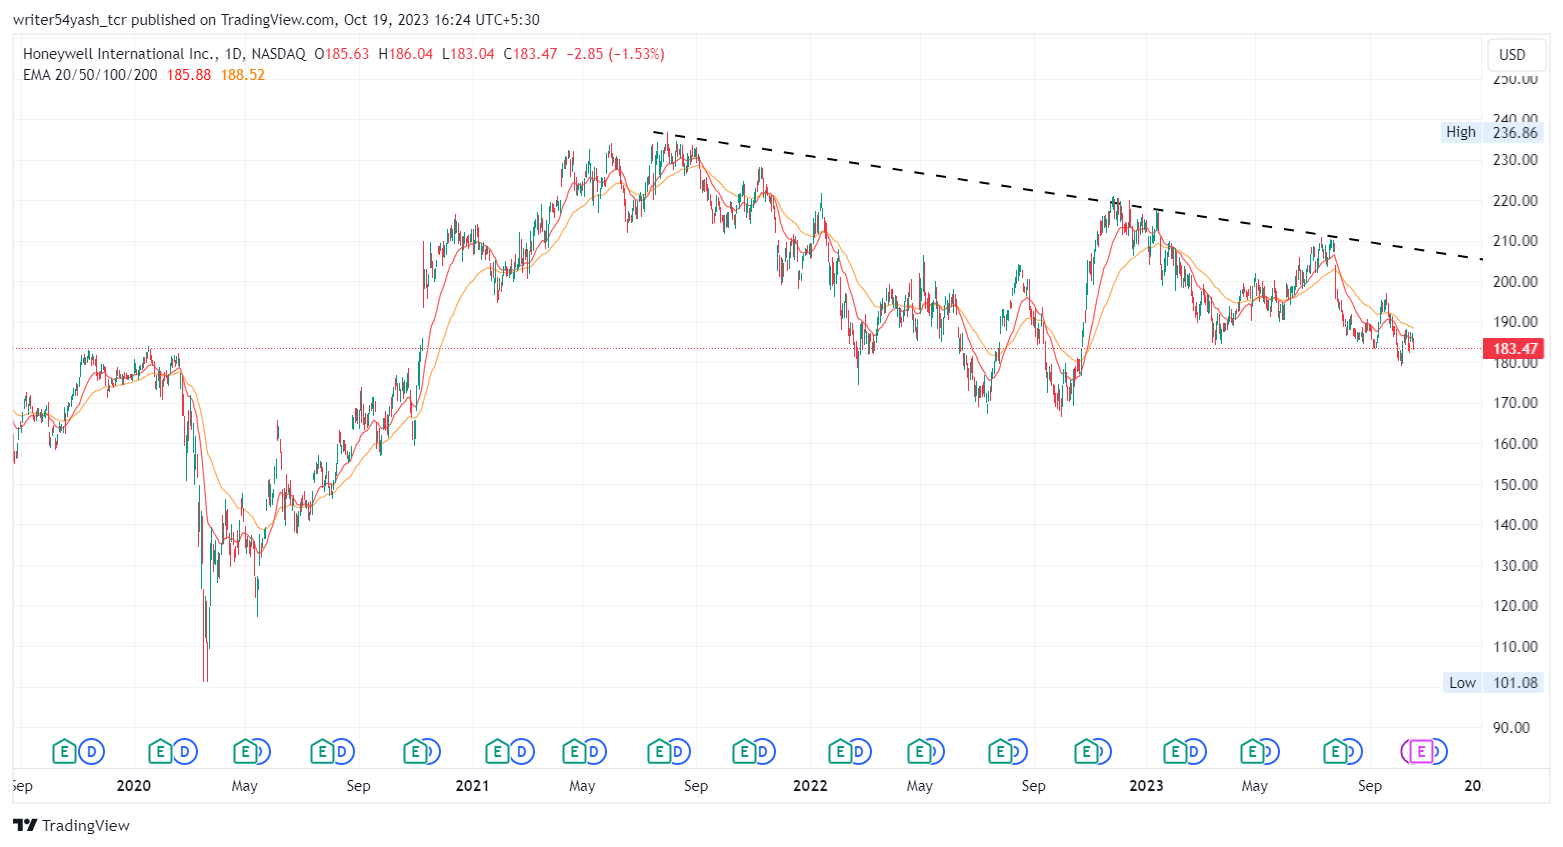
Currently, HON stock is trading near the 20-day exponential moving averages which are supporting the price momentum.
Nevertheless, if buying volume adds up, then the price might support bullish momentum by making higher highs and new highs. Hence, the HON price is expected to move upward giving a bullish outlook over the daily time frame chart.
The current value of RSI is 43.36 points. The 14 SMA is above the median line at 42.20 points which indicates that the HON stock is bullish.
The MACD line at 1.18 and the signal line at 1.31 are below the zero line. A bullish crossover is observed in the MACD indicator which signals strength in the momentum of the Honeywell stock price.
The stock has received positive and strong ratings from 25 analysts who have assessed the stock in the past three months. The analysts have given a range of $180 to $265 for the stock’s price in a year.
Summary
HON is a growing stock in the industrial sector. It has a strong quarter and positive ratings from analysts. It is trading near the 20-day EMA and has bullish indicators. It may rise to $200 or fall to $170 depending on the buying volume.
Technical Levels
Support Levels: $180 and $170
Resistance Levels: $195 and $200
Disclaimer
In this article, the views, and opinions stated by the author, or any people named are for informational purposes only, and they don’t establish the investment, financial, or any other advice. Trading or investing in cryptocurrency assets comes with a risk of financial loss.

Andrew is a blockchain developer who developed his interest in cryptocurrencies while pursuing his post-graduation major in blockchain development. He is a keen observer of details and shares his passion for writing, along with coding. His backend knowledge about blockchain helps him give a unique perspective to his writing skills, and a reliable craft at explaining the concepts such as blockchain programming, languages and token minting. He also frequently shares technical details and performance indicators of ICOs and IDOs.


