
 Home
Home News
News

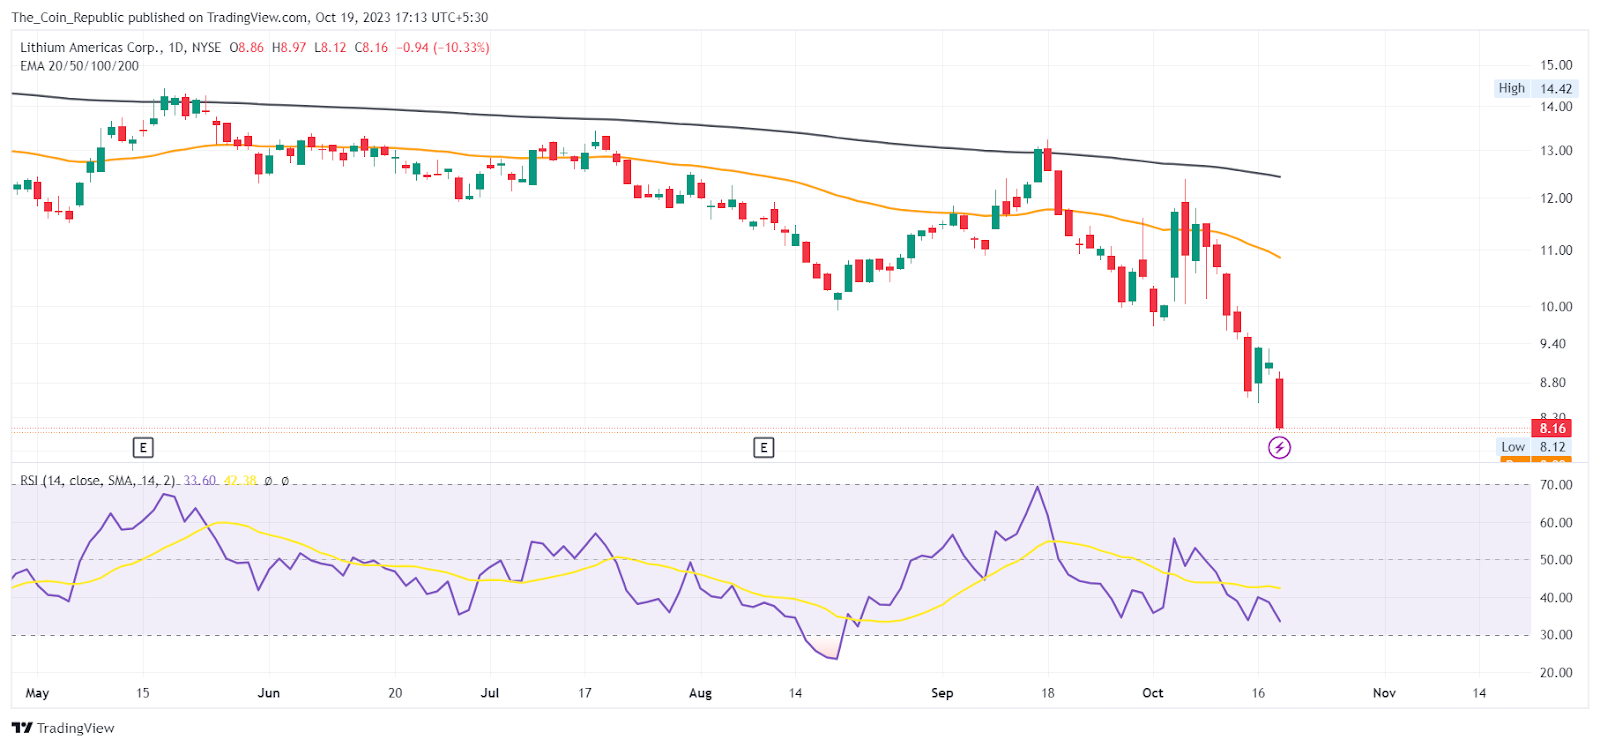
- LAC stock price slumped over 10% in Intraday on Wednesday and closed at $8.16.
- LAC stock price fell below the key moving average of 50-day EMA.
- Lithium Americas Corp. stock price has wiped out over 30% of its value in the past week and exhibits a strong bearish trend.
LAC stock price slumped 10.33% on Wednesday and currently trades at $8.12. The stock crashed to a two-year low price. The recent sessions saw bearish dominance in the stock price as the price fell by more than 30% in the past week.
Moreover, the Lithium Americas Corp. stock has been bearish for the last three quarters and has been on a continuous decline taking short-term pullbacks. The 200-day EMA acted as a major dynamic resistance for the price as the stock price has suffered multiple rejections from the 200-day EMA and declined.

The technical indicators imply that the stock price has slipped below the 50-day and 200-day EMA; both indicating a bearish trend prevailing in the short term as well as the long term. RSI is also showing a bearish crossover of the SMA line indicating weakness over the charts.
The stock price may continue to decline in the short term until it faces some major support on the lower side. Recently, the LAC stock price has made a breakdown of a round level of $10, a major support.
LAC Stock Price Analysis Over Weekly Chart
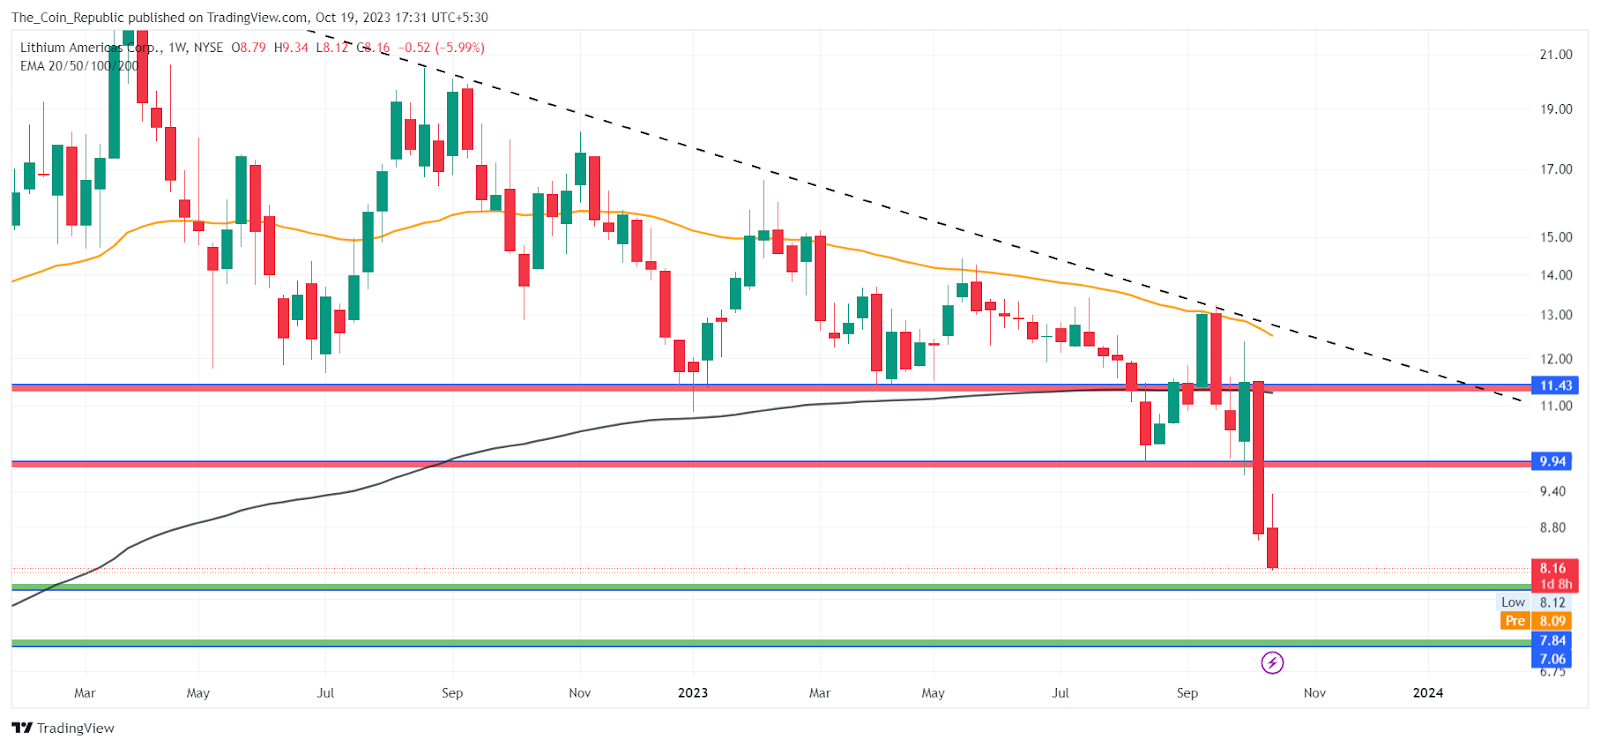
The weekly chart illustrates the formation and breakdown of a descending triangle pattern. Currently, the LAC stock price is nearing the previous demand zone which may halt the further fall.
Also, the LAC stock price fell below the 200-day EMA over the weekly chart indicating the stock price has turned bearish in the weekly timeframe and invites more sellers at every rise.
Technical Indicators Signal Bearish Outlook
The overall technical opinion rating including RSI and MACD is signaling a 90% “sell” with the strongest short-term outlook on maintaining the current direction.
Conclusion
LAC stock price is bearish in the short term and long term. The price has fallen by more than 30% in the past week and reached a two-year low of $8.12. The price broke down into a descending triangle pattern and a round level of $10.
The 200-day EMA is a major resistance for the price. The technical indicators show weakness and bearishness. The price may decline further until it finds strong support. The weekly chart shows the price is below the 200-day EMA and faces more sellers.
Technical Levels
- Support levels: $7.84 and $7.06
- Resistance levels: $9.94 and $11.43
Disclaimer
The views and opinions stated by the author, or any people named in this article, are for informational purposes only and do not establish financial, investment, or other advice. Investing in or trading crypto or stock comes with a risk of financial loss.

With a background in journalism, Ritika Sharma has worked with many reputed media firms focusing on general news such as politics and crime. She joined The Coin Republic as a reporter for crypto, and found a great passion for cryptocurrency, Web3, NFTs and other digital assets. She spends a lot of time researching and delving deeper into these concepts around the clock, and is a strong advocate for women in STEM.


