
 Home
Home News
News
- 1 MANU stock price trading below the key moving averages on the daily time frame.
- 2 Bears are overpowering the bulls on both daily and weekly time frames.
MANU stock price halted near the value of $26.05 and kept falling down. Buyers failed to maintain the momentum and started to exiting their positions, resulting in a marked decline.
On the last trading session on October 18th, MANU stock price opened at the level of $18.18 with a High of $18.27 and a low of $17.48. The stock price is close to the level of $17.55. Additionally, the the total change was 1.79% with a trading volume of 1.541 Million.
MANU stock has been in a downtrend throughout the year, forming lower highs and lower lows patterns, facing resistance from the upper trendline, which prevented it from breaking out of the trend.
The price action indicates that MANU stock has been under selling pressure, and that the buyers have been passive. On the other hand, the sellers have a strong advantage and continue to make short positions.
At press time, Manchester stock price was $17.55 with an intraday loss of 1.79%. It broke below the 50, 100, and 200-day EMAs, showing bearishness. Moreover, the intraday trading volume is 1.541 Million, and the average 10-day volume of 2.027 Million. The market cap of Manchester stock is $2.027 Billion.
Over the span of a week, Manchester stock experienced a decrease of approximately 8.07%, and in the course of a month, the decline was 9.07%. Over a three-month period, MANU stock has dropped by about 19.90%, while the decline extended to around 14.81% over the last six months. Furthermore, the stock’s performance throughout the year has been lackluster, with a year-to-date loss of approximately 25.10%.
Will MANU Stock Bounce Back From the Lower Levels?
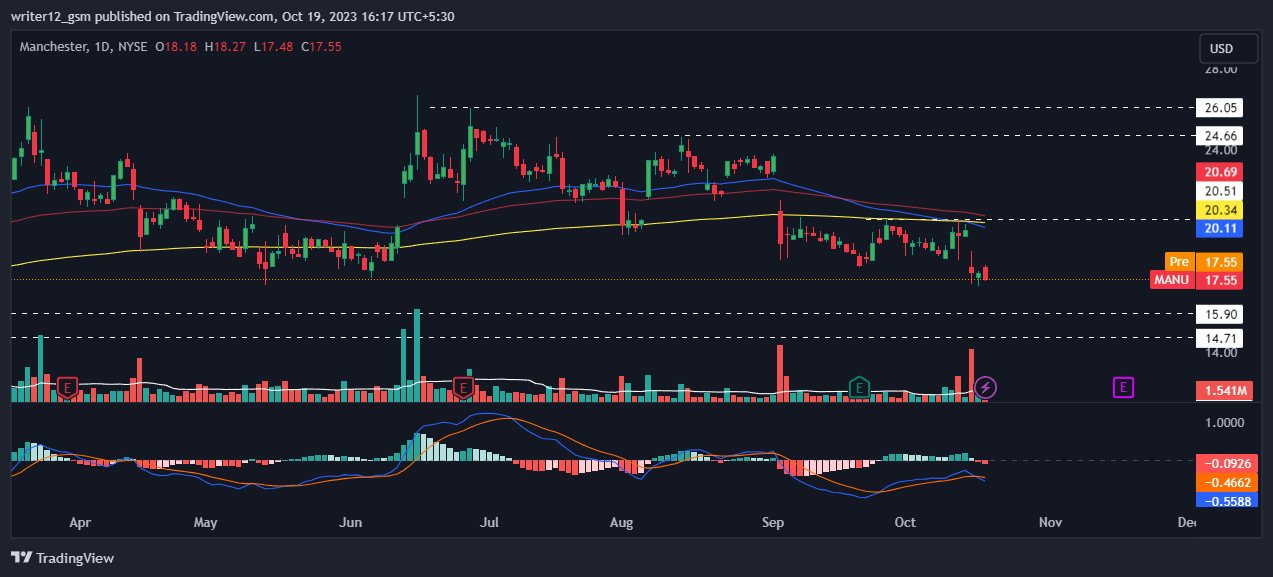
MANU stock price is currently below the 50, 100, and 200-day EMAs, which are supporting the price trend. However, if selling pressure increases, the price could break below these EMAs.
The RSI indicator is currently at 34.51 which is near the overbought zone. However, the 14-day EMA is above the RSI curve, which is a bearish signal.
The MACD indicator is also bearish, with the MACD line crossing below the signal line. This indicates that the MANU stock is likely to continue to fall in the upcoming future sessions. Overall, the technical indicators suggest that MANU’s stock price is bearish. However, if it can maintain the current level, it could continue to surge in the near future.
As per trading view, analysts gave a positive rating to the MANU stock. They gave a maximum target of $21.41.
Conclusion
MANU stock price technical oscillators also support the bearish trend. The MACD, RSI, and EMAs are highlighting bearish signs and imply that the downtrend may continue in the Manchester stock price. MANU price action suggests that the investors and traders are bearish on the 1-day time frame. The price action reflects a bearish perspective at the moment.
Technical Levels
Support Levels: $26.05 and $24.66.
Resistance Levels: $15.90 and $14.90.
Disclaimer
This article is for informational purposes only and does not provide any financial, investment, or other advice. The author or any people mentioned in this article are not responsible for any financial loss that may occur from investing in or trading. Please do your own research before making any financial decisions.
Steve Anderson is an Australian crypto enthusiast. He is a specialist in management and trading for over 5 years. Steve has worked as a crypto trader, he loves learning about decentralisation, understanding the true potential of the blockchain.


