
 Home
Home News
News
- 1 Tesla stock price broke the 50 and 100 EMA levels showcasing bearishness.
- 2 TSLA stock price dropped by 4.78% in the last trading session.
- 3 Tesla missed the earnings estimates, triggering a price fall.
Tesla missed its earnings expectations resulting in a 4.78% drop in the stock price. Tesla’s disappointing Q3 earnings could be a major worry for investors. On October 18, 2023, Tesla released its quarterly result which did not match Wall Street estimates. It seems that recent price cuts in its electric vehicle also affected the company’s earnings.
Tesla reported $23.4 Billion in revenue which was less than the analysts’ forecast of $24.09 Billion. EPS was $0.66 less the the estimated $0.74. Moreover, gross profit declined by 22% year-over-year. Net income was $1.9 Billion which also missed the estimated $3.3 Billion.
The Tesla stock chart was dominated by the bears in the last trading session as the price dropped by 4.78% post earnings release. Pessimism surrounds TSLA stock price at the moment. However, since, with volatility comes opportunity – a long-held belief in the stock market – the stock could produce a bounce back from the 200-day support level.
Bears look aggressive, pulling the price down. However, the bulls are also not in the mood to shift their power to bears as the price is trading above the key moving averages of 100 and 200.
TSLA stock price needs to attract more buyers to register the stock’s recovery phase over the charts. The Tesla stock price may soon attempt to make a bullish recovery. However, as it is trading below the 20 and 50 levels, the buyers will have to face multiple resistance levels in order to attain the target. Bulls are presently making continuous efforts to retake charge of the trend.
Will Tesla Stock Price Break Below 200 EMA Level?
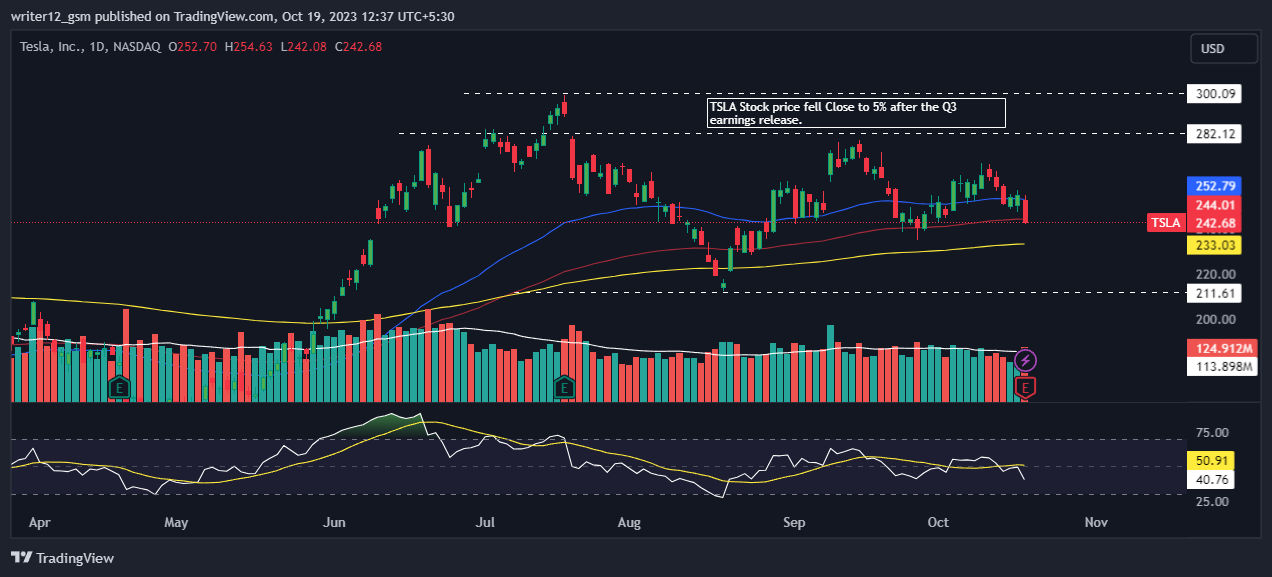
Tesla’s stock price broke below the 20, 50, and 100 EMA levels heading towards the level of 200 EMA. However, the 200 EMA is the strong support on the daily chart, and probably a reversal from there might be seen in upcoming sessions.
The RSI indicator is in the neutral zone hovering at 40.76 heading towards the oversold zone. The 14 SMA curve is at the 50.91 points floating in the neutral zone showcasing neutrality in the stock price.
MACD curve gave a bearish cross and headed towards the negative territory. MACD curve is at -0.4040 and the signal curve is at 0.7330 points. However, both the curve is too close to each so it is difficult to decide the exact trend.
Conclusion
Tesla reported its Q3 earnings which did not match the earning expectations. Investors’ sentiments are negative about the stock after the Q3 earnings report. Key indicators like MACD, RSI, and EMAs are pointing to neutrality. However, the stock price might take bounce back from the 200 EMA level in upcoming sessions.
Technical Levels
Support Levels: $233.03 and $211.00
Resistance Levels: $280.00 and $252.00
Disclaimer
This article is for informational purposes only and does not provide any financial, investment, or other advice. The author or any people mentioned in this article are not responsible for any financial loss that may occur from investing in or trading. Please do your own research before making any financial decisions

Adarsh Singh is a true connoisseur of Defi and Blockchain technologies, who left his job at a “Big 4” multinational finance firm to pursue crypto and NFT trading full-time. He has a strong background in finance, with MBA from a prestigious B-school. He delves deep into these innovative fields, unraveling their intricacies. Uncovering hidden gems, be it coins, tokens or NFTs, is his expertise. NFTs drive deep interest for him, and his creative analysis of NFTs opens up engaging narratives. He strives to bring decentralized digital assets accessible to the masses.


