
 Home
Home News
News

- 1 COTY stock price slid 1.43% in the last trading session and currently trades at $9.63.
- 2 Coty Inc. stock (NYSE: COTY) price slipped below the key exponential moving average of 200-day EMA.
- 3 Coty Inc. may announce its third quarterly results on Wednesday, 8th November.
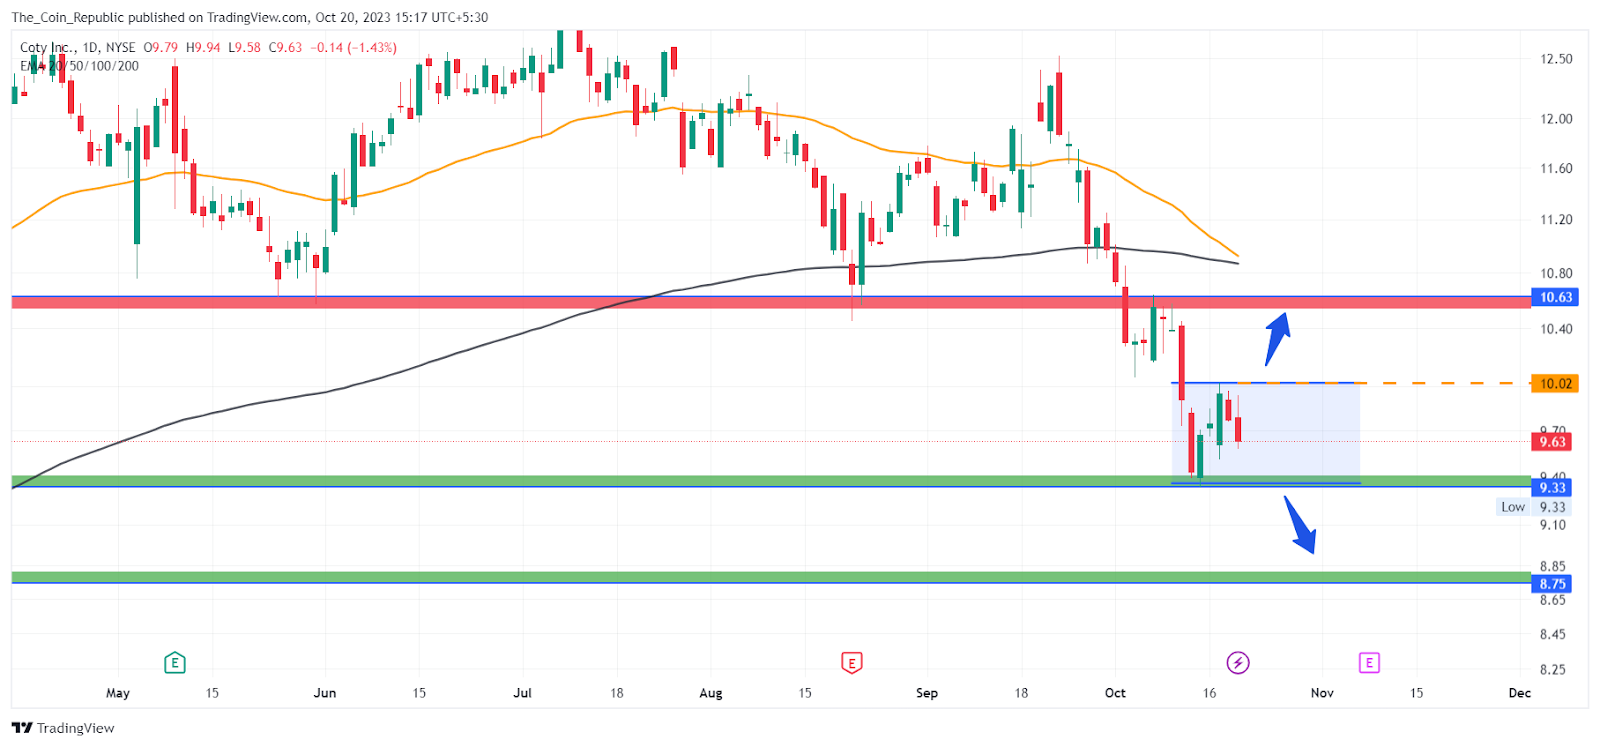
Coty Inc. (COTY) stock price fell 1.43% on Thursday and closed at $9.63. The stock price has recently broken below a major support of $10 and a 200-day EMA. The breakdown has turned the stock in favor of bears. The traders should look for sell-on-rise opportunities in the short term.
The price trend analysis of COTY stock elaborates that the stock persisted in a sideways trend in the last two quarters. The stock price hovered in a range with major support near $10 and major resistance near $13.
Moreover, the first half of the current quarter maintained a sideways trend. Thereafter, the stock price broke below the lower support of $10 and declined. The stock price might continue to decline further as the sellers are dominating the price trend.

Coty Inc. engages in the manufacture, marketing, sales, and distribution of branded beauty products. The company holds a market cap of $8.26 Billion. The daily volume received is more than the average 10-day volume indicating the continuation of the ongoing trend.
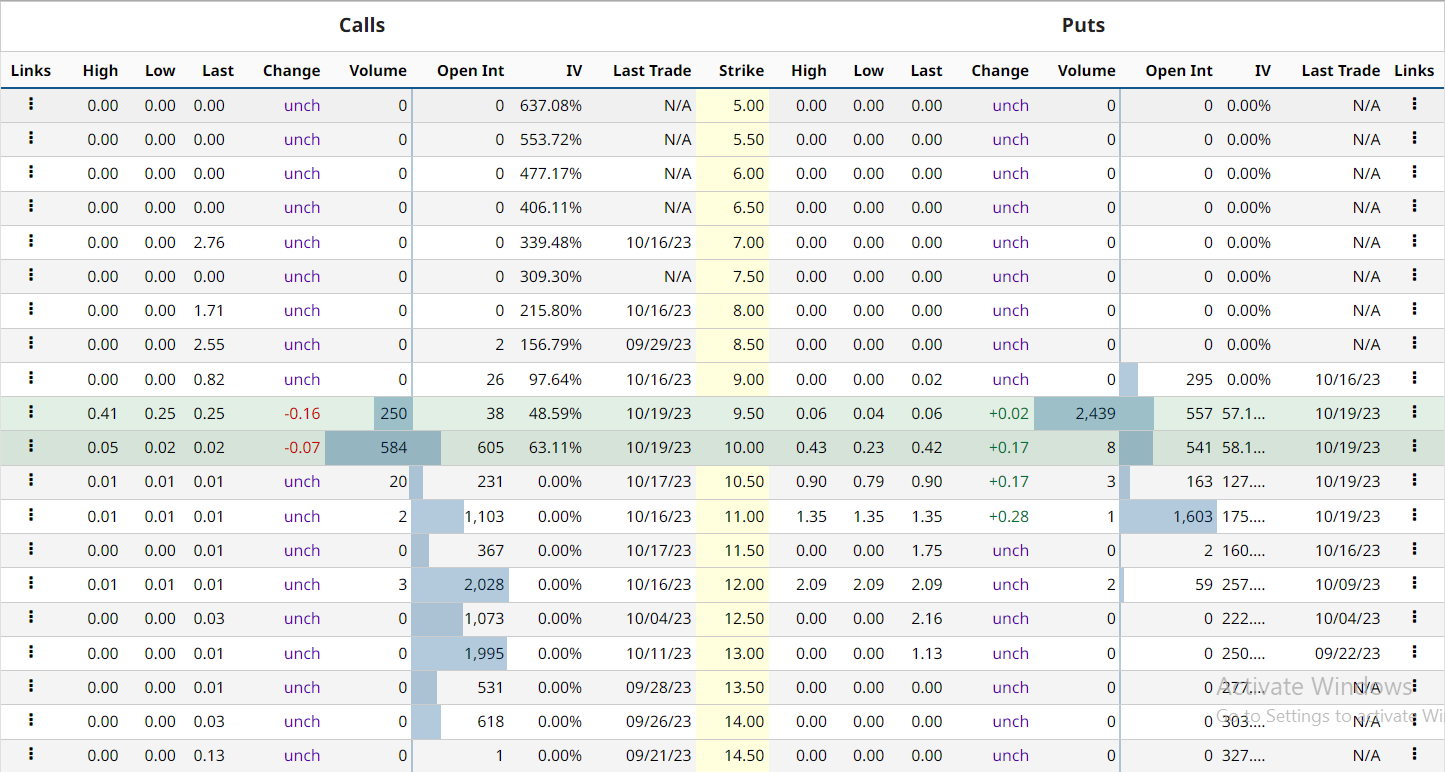
COTY stock option-chain analysis states that the current implied volatility in the market is 53.47% with an increment of 0.21% in the last trading session. The at-the-money strike has an OI of 547 on the PUT side and 38 on the CALL side indicating the domination of buyers at the CMP.
COTY Stock Price Made a Breakdown of Recent Support
Coty Inc. is yet to announce its third quarterly results on Wednesday, 8th November which may impact the stock price. The analysts are estimating revenue of $1.579 Billion and earnings of $0.17 Billion. The price may show gains if the results outperform.
Technical Indicators Show Volatility in the Short Run
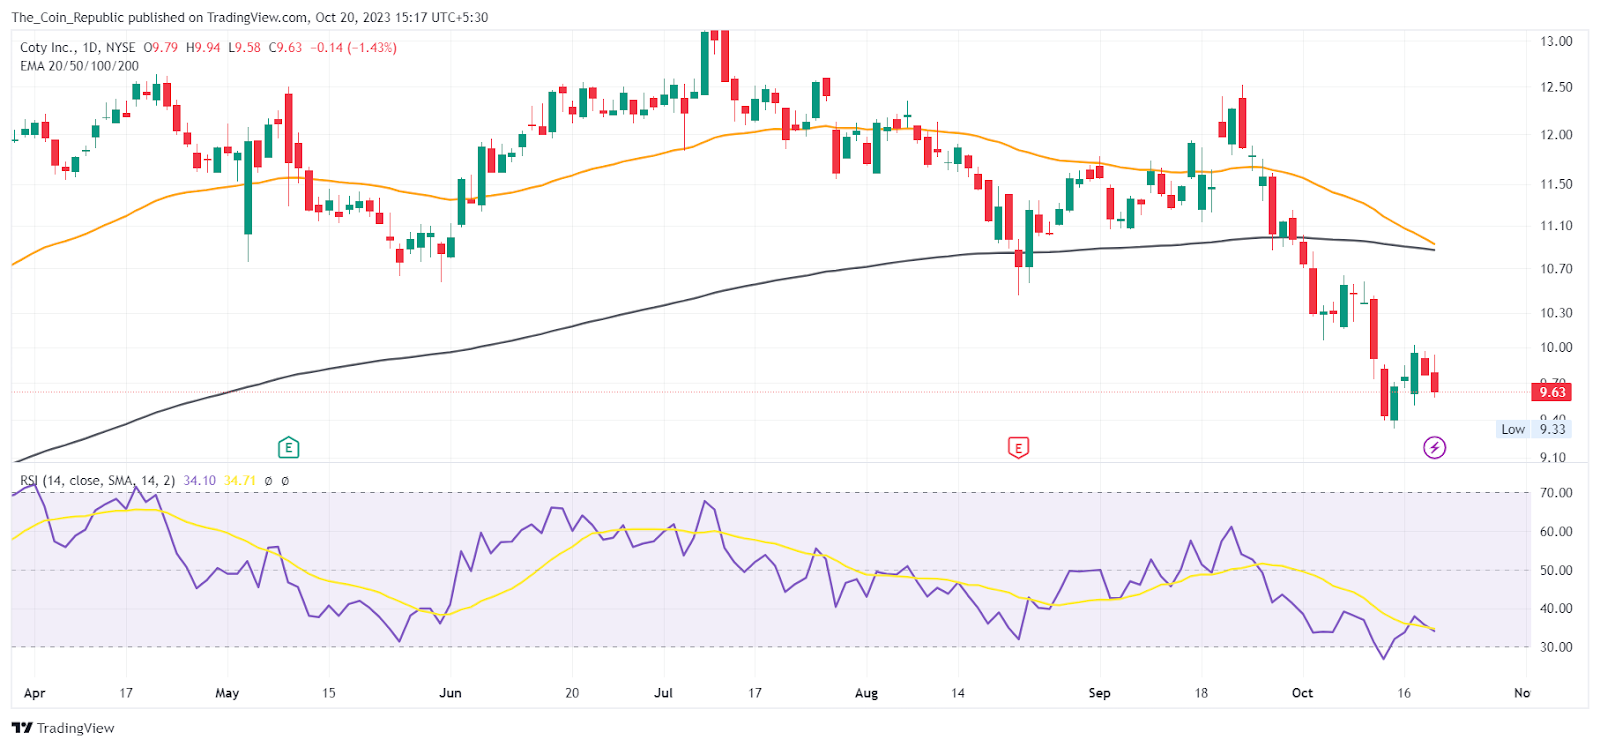
The daily COTY stock price chart shows that the price fell below the 50-day and 200-day EMA indicating a trend shift from bullish to bearish. At press time, the RSI lines are showing a negative crossover indicating weakness over the chart.
The overall technical opinion rating including RSI and MACD signals an 88% “sell” with the strongest short-term outlook on maintaining the current direction.
Conclusion
Coty Inc. stock price broke below a major support of $10 and 200-day EMA and turned bearish. The stock may decline further as the sellers dominate the trend. The company will report quarterly results on November 8th which may affect the price.
The analysts expect revenues of $1.579 Billion and earnings of $0.17 Billion for the current quarter. The price may rise if the results are surprising. The daily chart shows a trend shift from bullish to bearish and the RSI lines show weakness.
Technical Levels
- Support levels: $9.33 and $8.75
- Resistance levels: $10.02 and $10.63
Disclaimer
The views and opinions stated by the author, or any people named in this article, are for informational purposes only and do not establish financial, investment, or other advice. Investing in or trading crypto or stock comes with a risk of financial loss.

With a background in journalism, Ritika Sharma has worked with many reputed media firms focusing on general news such as politics and crime. She joined The Coin Republic as a reporter for crypto, and found a great passion for cryptocurrency, Web3, NFTs and other digital assets. She spends a lot of time researching and delving deeper into these concepts around the clock, and is a strong advocate for women in STEM.


