
 Home
Home News
News

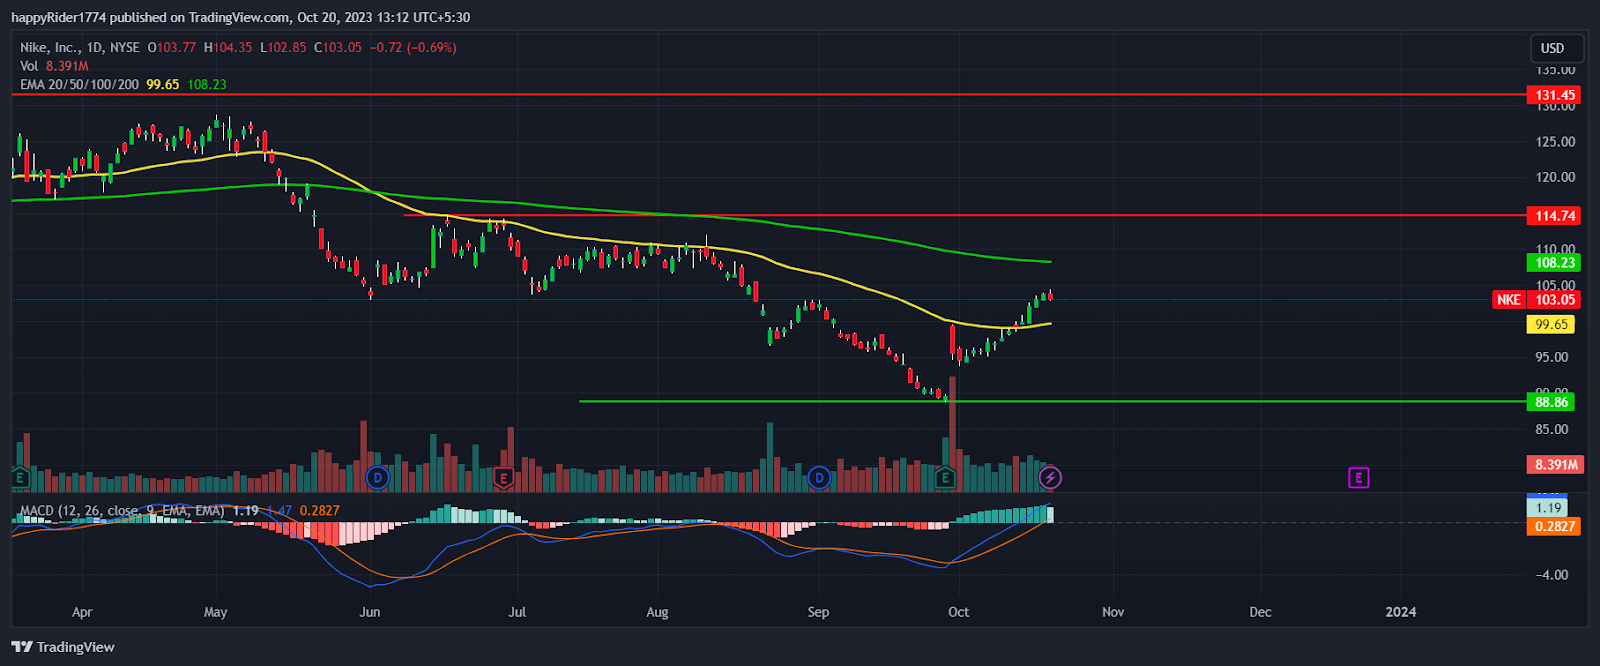
- 1 Nike stock price recovered 17% from the recent swing low.
- 2 NKE stock price sustains above the 50-day EMA and approaches the 200-day EMA.
- 3 The quarterly earnings positively impacted the Nike Inc. stock.
Nike stock price is in a recovery phase and continuing to rise upward by forming higher high candles.
NKE stock price recovered about 17% from the recent swing low at $88.66 and managed to climb above the 50-day EMA. It shows that the short-term trend has turned upward and bulls are returning back on track.
However, the 200-day EMA still stands above the current price which may act as an immediate hurdle for bulls.
For the last few months, NKE stock price has been in a declining phase and traded with a bearish bias. Recently, a few weeks ago, the quarterly earnings were released due to which the stock price showed a sudden rise and halted the downfall.
Nike Inc. reported an EPS of 0.94 and revenue of $12.939 Billion. The company beat the EPS estimates by 24.37% but missed the revenue estimates by 0.47%.
Luckily, the investors were satisfied with the earnings and the stock price rose 6% on a single day after earnings. It triggered positive sentiments and the stock price began the recovery.
Nike stock price closed the previous session at $103.05 with an intraday decline of -0.69%.
Will Nike Stock Price Sustain the Recent Gains?
Nike stock price (NYSE: NKE) regains the $100 level indicating buyers are active. However, the bulls might lose momentum near the supply zone and narrow range consolidation is expected.
Till the NKE stock price sustains above $94.00 the buyers will be active and absorb the selling. The stock picks up momentum when buyers are able to push the price above the 200-day EMA.
The technical analysis suggests that the recent rally is supported by genuine buying and the price is likely to sustain the recent gains.
NKE Stock Price Showed Initial Sign of Bullish Trend Reversal
NKE stock price rose for three consecutive weeks and displayed the initial signs of a bullish trend reversal. However, it will be interesting to see whether the buyers are able to give the follow-up momentum or not.
The MACD curve slopes upward and the positive crossover gets wider. It indicates bullish momentum in the Nike shares is likely to continue and more upside is pending. However, the RSI at 67 near the overbought territory indicates short-term retracement is possible.
Conclusion
Nike stock price is recovering and buyers are trying their best to bring back the confidence of the long-term investors.
The technical analysis suggests that NKE stock price may consolidate for some time in a narrow range before resuming the recovery.
Technical Levels
- Resistance levels: $108.23 and $114.74
- Support levels: $94.00 and $88.86
Disclaimer
The views and opinions stated by the author, or any people named in this article, are for informational purposes only. They do not establish financial, investment, or other advice. Investing in or trading crypto assets comes with a risk of financial loss.

Andrew is a blockchain developer who developed his interest in cryptocurrencies while pursuing his post-graduation major in blockchain development. He is a keen observer of details and shares his passion for writing, along with coding. His backend knowledge about blockchain helps him give a unique perspective to his writing skills, and a reliable craft at explaining the concepts such as blockchain programming, languages and token minting. He also frequently shares technical details and performance indicators of ICOs and IDOs.


