
 Home
Home News
News
- 1 The RTX stock price technical tools highlight bullishness in stock.
- 2 RTX Corporation (NYSE: RTX) stock’s earnings are near which will decide its direction.
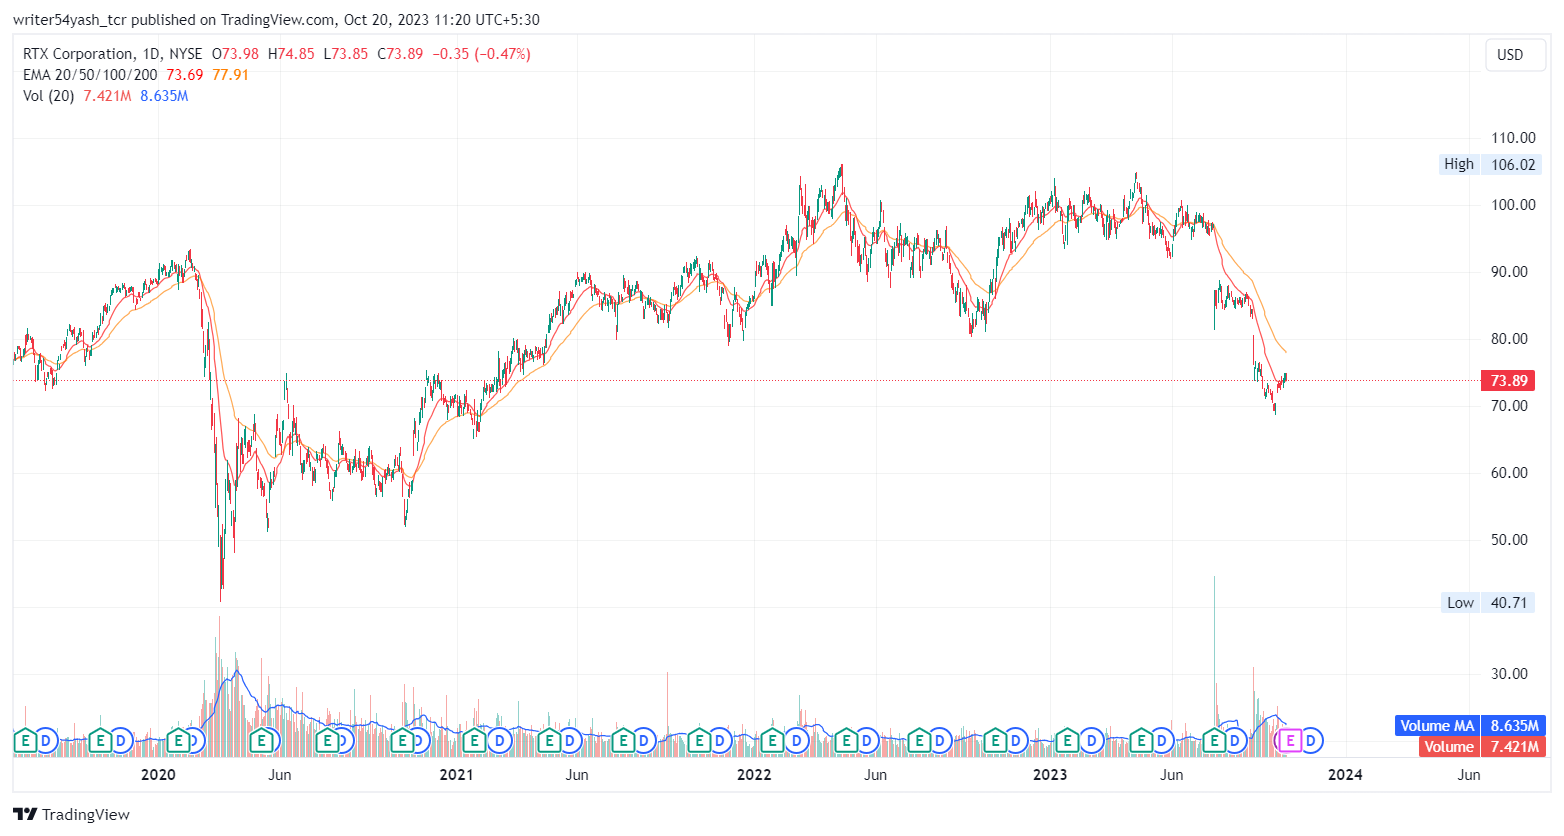
According to the RTX Corporation (NYSE: RTX) price action, it seems that the stock is poised for a significant rise, with potential growth in price for the next sessions. The RTX stock price rose from the $40 support level in March back in the year 2020, when buyers invested heavily, and the price reached a peak of $106 on April 21st, 2022, forming higher highs and lows.
The RTX stock faced resistance and started to decline as investors took their profits from several quarterly reports and dividends. Despite the positive earnings results and consistent dividend payments of the RTX stock, the sell-off continued which led to a significant drop in the price.

This indicated a weak performance on the charts for the RTX price in the past 52 weeks. However, the stock has shown a sign of recovery as the price bounced back from $68 and tried to maintain its position on the charts. The upcoming earnings are closed as they will be publicized on October 24th, 2023.
Therefore, if the RTX stock can attract strong buying momentum and break above the previous swing high, it can trigger a rally upwards. The possible resistance levels are between $76.5 and $80.5.
On the other hand, if the RTX stock faces resistance again and keeps falling and breaks below $68.5, it will drop to $64.5.
The stock ratings for RTX stock are favorable and strongly suggested based on 26 analysts who have assessed the stock in the last three months. The 1-year price prediction for RTX stock by 23 analysts varies from $70.00 to $110.00.
Will Earnings Thrust the RTX Price Up?
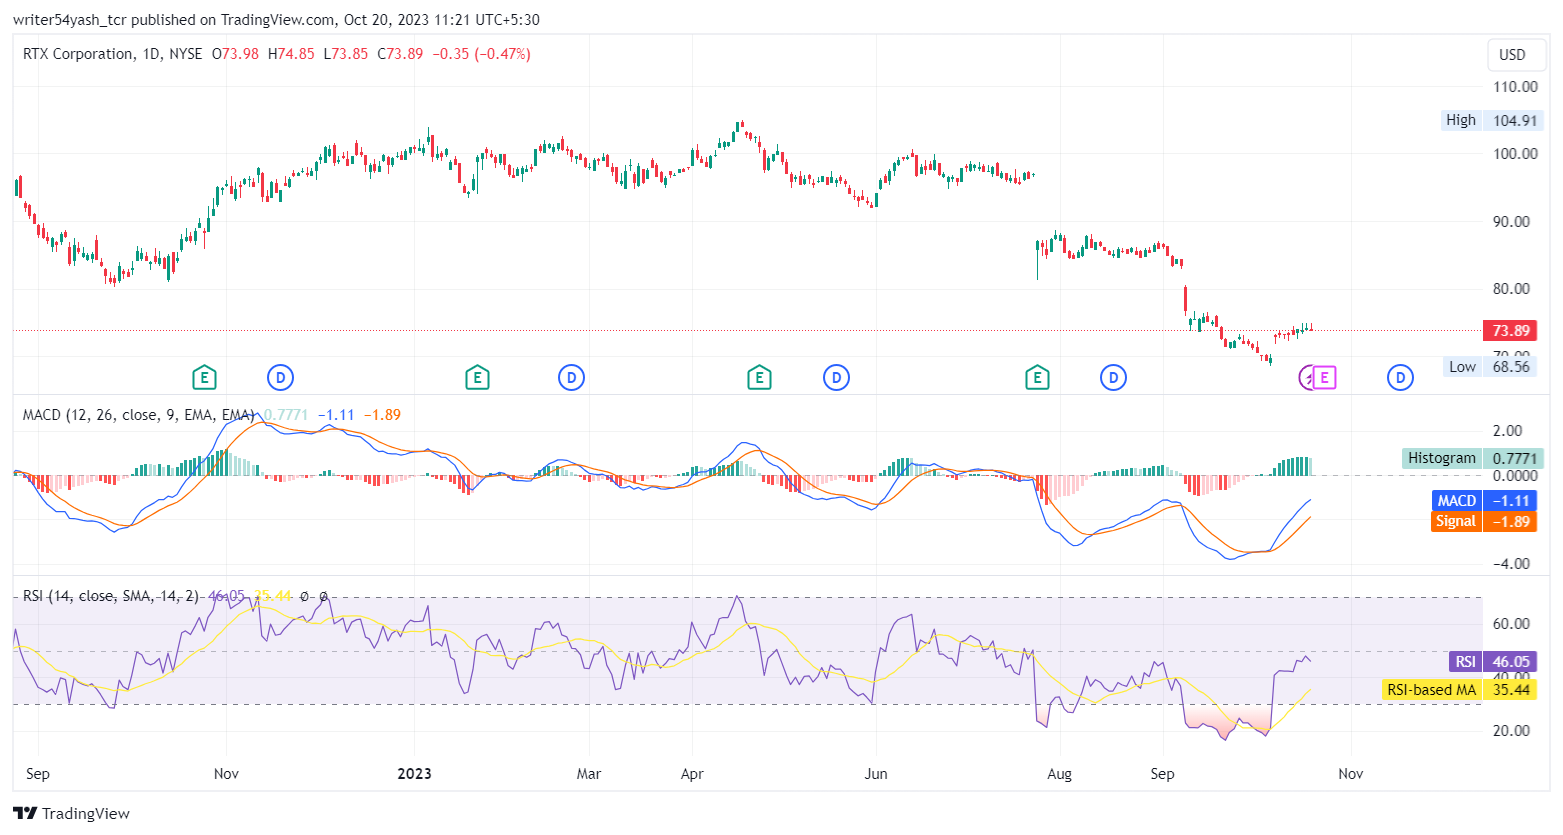
The price of RTX Corporation (NYSE: RTX) bounced back from around $68 and moved upward, trading close to 20 EMA and may soon cross over 50 EMA. Therefore, if more buying volume supports the RTX price in moving upwards, the stock may overcome major resistance levels and initiate an upward rally.
The MACD is at 1.11 below the zero line indicates a bullish cross and shows bullishness as the histogram width is broadening in the MACD tool. The RSI is at 46.05 as it took support on 14 SMA which is at 35.44. The indicators in the RTX stock show positive signs on the charts.
Summary
The RTX Corporation (NYSE: RTX) chart shows that the share price has a positive and bullish sentiment on the 1-D timeframe. The price action indicates a bullish outlook at the time of publishing as it has taken support from the last surge in price. The technical analysis tools of the RTX stock price point to upward signals and confirm bullishness.
Technical Levels
Support Levels: $68.5 and $64.5
Resistance Levels: $76.5 and $80.5
Disclaimer
In this article, the views, and opinions stated by the author, or any people named are for informational purposes only, and they don’t establish the investment, financial, or any other advice. Trading or investing in cryptocurrency assets comes with a risk of financial loss.
Mr. Pratik chadhokar is an Indian Forex, Cryptocurrencies and Financial Market Advisor and analyst with a background in IT and Financial market Strategist. He specialises in market strategies and technical analysis and has spent over a year as a financial markets contributor and observer. He possesses strong technical analytical skills and is well known for his entertaining and informative analysis of the Financial markets.


