
 Home
Home News
News

- 1 FSR stock price is declining steadily, losing over 10% in a week.
- 2 Fisker Inc. reported 98% less revenue than estimated in Q2 2023.
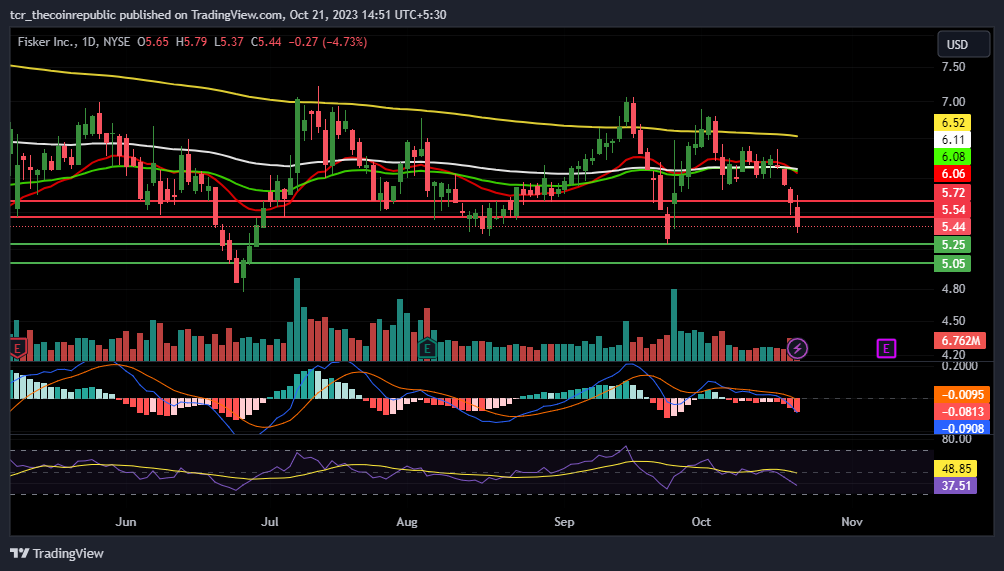
- 3 When writing, Fisker stock was trading below 20, 50, 100 and 200 day EMAs.
Fisker Inc. stock price has followed a constant decline for the past one quarter and lost 10.23% of its trading price in a week; and 13.92% monthly. In the 52 weeks time frame, FSR stock peaked at $8.85 and its lowest traded price was $4.26.
Fisker Inc (FSR) Stock Price Analysis
A major decline in FSR stock price was triggered on October 18 and after losing 3.55% on October 19 and 4.73% on October 20, it fell below 20, 50, 100 and 200 day exponential moving averages.

Fisker, Inc. has a market capitalization of $1.867 Billion. Data from companiesmarketcap(dot) shows that company’s market capitalization declined 17.66% in 2023.
The MACD and signal line are approaching the negative territory and significant bear accumulation is seen below the zero line. The RSI line is on the brink of entering the negative region and further bearishness is expected.
Despite weekly, monthly and quarterly decline, FSR stock price surged more than 20.62% in the past six months. Fisker, Inc. stock has an annual price target $9.28, the target is 70.55% greater than press time trading price.
TradingView data shows that 191.85 Million Fisker Inc. shares are free floating and remaining 19.03 Million shares are closely held.
Fisker Inc (FSR) Financial Updates
Fisker Inc failed to meet the estimates and reported 98.31% less revenue than estimated. However the reported EPS seems to be opposing the estimates as the company reported 9.38% more EPS.
The estimated EPS of the company for the third quarter is negative $0.22 and revenue is $143.10 Million. In the financial year 2022, the company reported $342.00k in revenue from which, its net income was negative $547.50 Million and profit margin was negative 160086.55%.
In the long term, total liabilities of the company are $704.04 Million and assets are $683.97 Million.
Fisker, Inc. engages in building a technology-enabled automotive business model, which involves vehicle development, customer experience, and sales and service. It also designs, develops, and manufactures eco-friendly electric vehicles.
Technical Levels
Support Level: $5.25 & $5.05
Resistance Level: $5.54 & $5.72
Conclusion:
When writing, FSR stock was trading below 20, 50, 100 and 200 day EMAs and the reason behind the decline is immense selling pressure. The MACD and signal line both are reflecting bearishness and future downfall is expected in the coming weeks.
Disclaimer
The views and opinions stated by the author, or any people named in this article, are for informational ideas only and do not establish financial, investment, or other advice. Investing in or trading crypto assets comes with a risk of financial loss.
Steve Anderson is an Australian crypto enthusiast. He is a specialist in management and trading for over 5 years. Steve has worked as a crypto trader, he loves learning about decentralisation, understanding the true potential of the blockchain.


