
 Home
Home News
News
- 1 KMB stock retested the demand zone of $115 and initiated a reversal.
- 2 On the support zone, a hammer candlestick was formed which indicates strong rejection.
Kimberly Clark Corporation (NYSE: KMB) KMB share price has shown a correction and has retested the demand zone of $115. The hammer candlestick was formed on the base along with a reversal. However, the KMB stock price is close to the barrier of $125, near the 100 day EMA. Bulls need to surpass the immediate hurdle to extend the buying momentum to reach the supply zone of $130. However, the falling trendline acts as a strong resistance.
KMB stock price is trading near the neutral region and has surpassed the 50 day EMA indicating the buying interest developed in the last trading sessions. Amid the correction, KMB stock did not fall much and has trapped the bears in the past sessions. Per the options chain, at the strike price of $122, there is a massive open interest of 410 hundred shares on the call side, whereas at the put side only 135 hundred shares.

At press time, KMB stock price was $123.09 with an intraday gain of 0.19% showing neutrality on the charts. Moreover, the trading volume increased by 0.67% to 2.14 Million and the market cap is $41.627 Billion. Furthermore, analysts have maintained a neutral rating with a yearly target price of $131.09 suggesting a growth outlook.
Kimberly-Clark Corp. engages in the manufacture and marketing of products made from natural or synthetic fibers. It operates through the following segments: Personal Care, Consumer Tissue, and K-C Professional. The Personal Care segment offers disposable diapers, training and youth pants, swim pants, baby wipes, feminine and incontinence care products, and other related products. The Consumer Tissue segment produces and sells facial and bathroom tissue, paper towels, napkins, and related products for household use.
Will KMB Extend Recovery Phase Above $125?
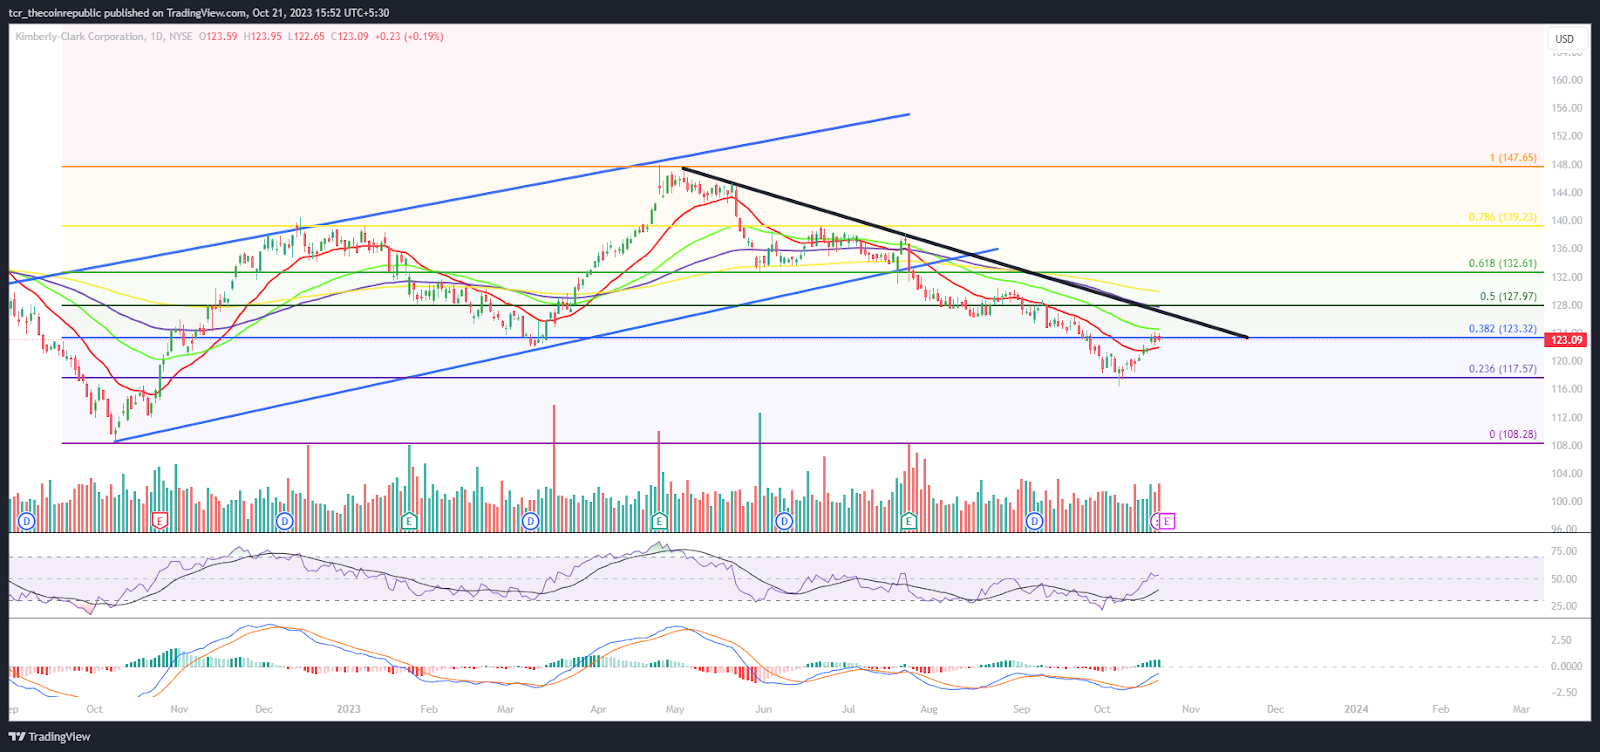
On the daily charts, KMB stock has shown a reversal from the demand zone of $115 and initiated a pullback which led to surpass the 50 day EMA. Furthermore, the short positions were trapped and further short covering moves will be seen. As per the Fib levels, KMB stock price has supported the 23.6% level and has surpassed the 38.2% level. Moreover, the KMB stock has surpassed the mid bollinger band and is heading toward the upper bollinger band.
The RSI curve is in the overbought zone and has formed a positive crossover suggesting a positive outlook for the next sessions.The MACD indicator showed a bullish crossover and formed green bars on the histogram highlighting buyer accumulation.
Summary
Kimberly Clark Corporation (NYSE: KMB) KMB stock price has surpassed the 50 day EMA and is heading toward the 100 day EMA barrier near $125. Furthermore, the price action shows that buyers are accumulating and are willing to sustain at the neutral zone near $150. However, the bulls must surpass $130 to chase the buying momentum which would lead to a trend reversal.
Technical Levels
Support Levels: $120 and $110
Resistance Levels: $125 and $135
Disclaimer
The views and opinions stated by the author or any other person named in this article are for informational purposes only and do not constitute financial, investment, or other advice. Investing in or trading crypto or stocks comes with a risk of financial loss.

Andrew is a blockchain developer who developed his interest in cryptocurrencies while pursuing his post-graduation major in blockchain development. He is a keen observer of details and shares his passion for writing, along with coding. His backend knowledge about blockchain helps him give a unique perspective to his writing skills, and a reliable craft at explaining the concepts such as blockchain programming, languages and token minting. He also frequently shares technical details and performance indicators of ICOs and IDOs.


