
 Home
Home News
News
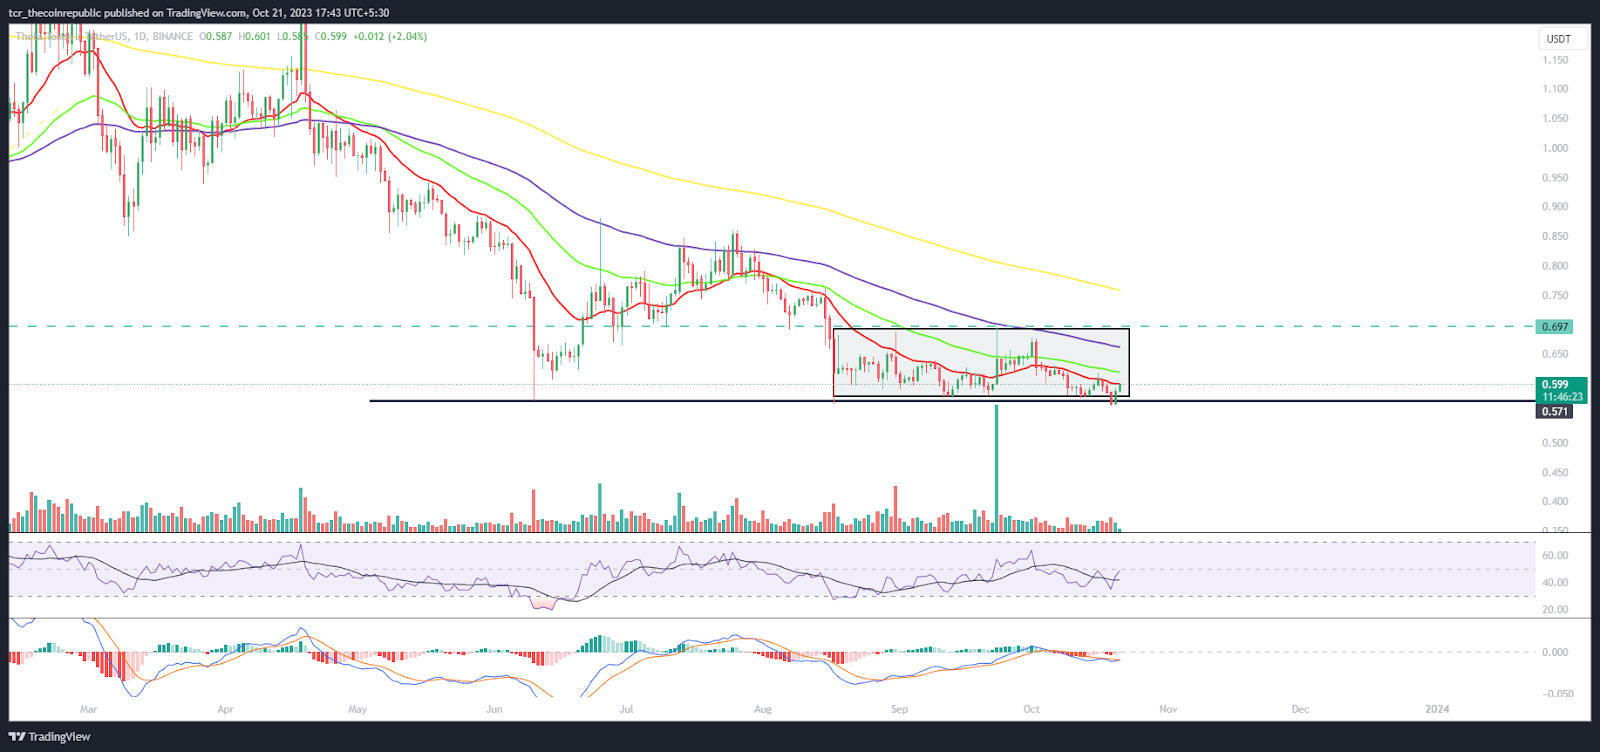
- 1 THETA token price is holding the gains near the crucial support zone of $0.600.
- 2 Buyers are trying to surpass the 20 day EMA to attain a pullback.
THETA token chart shows selling pressure. The chart shows the triple bottom pattern and stayed near the crucial support zone of $0.600. Tthe price action shows that the selling pressure is fading and that THETA is consolidating.
THETA token price is trading below the significant moving averages and is hovering near the crucial support zone of $0.600 which if broken, a sharp fall toward the round mark of $0.500 would be anticipated. Conversely, the chart shows the triple bottom pattern which signals the bounce, favoring the bulls. However, bulls must surpass the 50 day EMA barrier to attain enough buying momentum.
THETA token price chart shows that buyers are struggling to hold the gains and are attempting a pullback to retain the swing of $0.650 followed by $0.700. However, the technicals are signaling a pullback and favor the bulls.
At press time, THETA token price was $0.600 with an intraday gain of 2.24%, showing neutrality on the charts. Moreover, trading volume increased by 2.67% to $7.37 Million. The pair of THETA/BTC was at 0.0000201 BTC. However, the market cap of THETA token was $598 Million. Furthermore, analysts maintained a neutral rating and suggest that underperformance will continue.
Will THETA Token Attain a Bounce?
On the daily charts, THETA token price is trading below the 20 day EMA and is trying to surpass the immediate resistance zone of $0.620 to initiate a reversal. However, THETA token price is close to the demand zone suggesting a rebound amid the downtrend. Furthermore, the THETA token price held at the 38.2% Fibonacci retracement zone and is close to the lower bollinger band.
The RSI curve is near neutrality and showed a bullish divergence suggesting a bounce in the coming sessions.
The MACD showsb a bearish crossover and red bars on the histogram highlighting the volatility.
Summary
THETA token price is trading below the significant moving averages and was in a downtrend. Bulls are consolidating inside the congestion zone and are trying to surpass the 20 day EMA immediate barrier to register a pullback.
Technical Levels
Support Levels: $0.580 and $0.530
Resistance Levels: $0.620 and $0.650
Disclaimer
The views and opinions stated by the author or any other person named in this article are for informational purposes only and do not constitute financial, investment, or other advice. Investing in or trading crypto or stocks comes with a risk of financial loss.

With a background in journalism, Ritika Sharma has worked with many reputed media firms focusing on general news such as politics and crime. She joined The Coin Republic as a reporter for crypto, and found a great passion for cryptocurrency, Web3, NFTs and other digital assets. She spends a lot of time researching and delving deeper into these concepts around the clock, and is a strong advocate for women in STEM.


