
 Home
Home News
News

- 1 BSV Crypto price is trading above the key moving averages showing bullishness on the daily timeframe.
- 2 Bitcoin SV crypto price is facing rejection from the level of $56.29.
Bitcoin SV (BSV) price is gaining momentum and breaking above the 20, 50, 100, and 200-day EMAs, indicating bullishness in the previous trading sessions. The chart also shows a breakout of the key EMAs, with its neckline breached at $35 as the crypto had a sharp rally.

The crypto has tested the demand zone near $35 multiple times, finding support and bouncing back. Buyers have regained their strength and are aiming for the $60 level in the next sessions.

The chart structure shows a volatile movement in the previous months, with the crypto facing multiple rejections from the supply range of $56. The lower levels near $35 to $40 acted as a support region, and the crypto bounced from there.
Furthermore, the crypto’s trajectory shows that beyond $56, the zone is bullish, and a rally could be seen. But, if further rejection takes place, then the crypto will continue to trade in the congestion zone. Similarly, below $35, bearishness could be extended.
At press time, Bitcoin SV crypto was trading at $49.73 with an intraday minor loss of 3.38% breaking below the 200-day EMA, showing bearishness on the charts. Moreover, the intraday trading volume is 97.479. The market cap of Bitcoin SV crypto is 957.702 Million.
Technical Analysis of Bitcoin SV Crypto Price in 1-D Timeframe
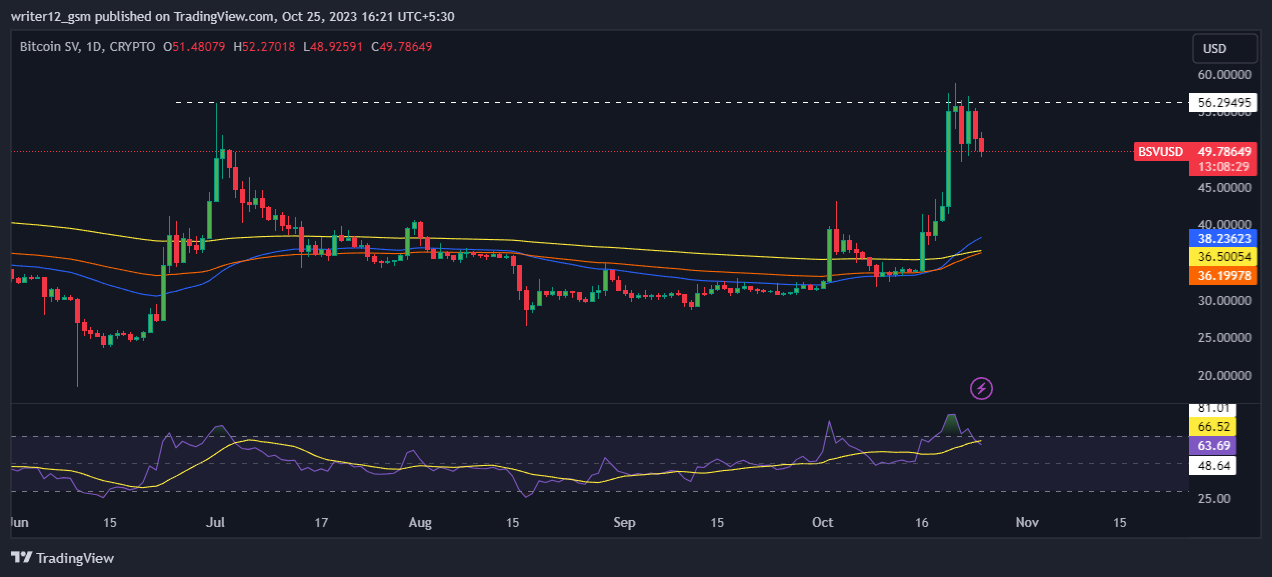
Currently, Bitcoin SV crypto price is trading above the 50 and 200-day SMAs (Simple moving averages), which are supporting the price momentum.
However, if buying volume adds up, then the price might support bullish momentum by making higher highs and new highs. Hence, the Bitcoin SV price is expected to move upward giving bullish views over the daily time frame chart.
The current value of RSI is 63.68 points. The 14 SMA is above the median line at 66.52 points, indicating that the Bitcoin SV crypto price is bullish.
The MACD line at $5.06203 and the signal line at 3.77038 are above the zero line. A bullish crossover is observed in the MACD indicator which signals strength in the momentum of the BSV crypto price.
Short-Time Horizon Analysis
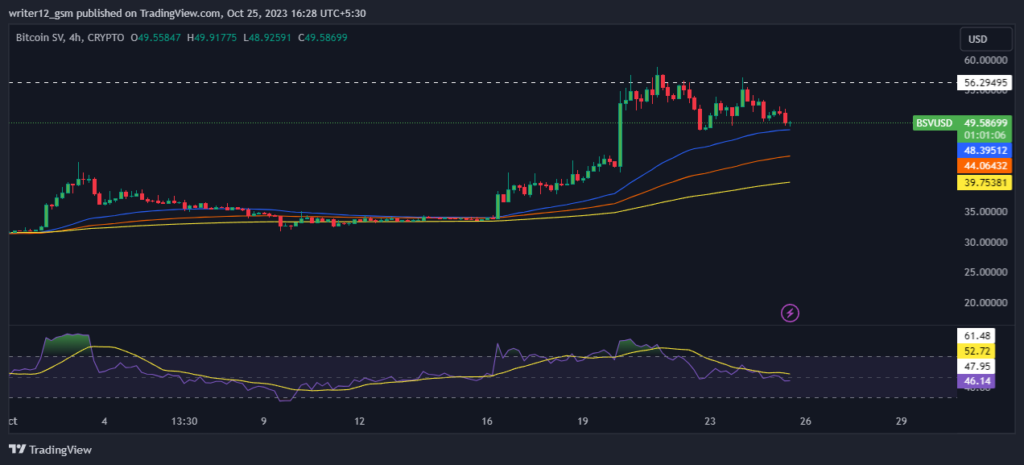
Bitcoin SV crypto has shown sellers’ strength, and profit booking in the crypto was noted on the short-term charts. Moreover, the price traded below the key EMAs, which shows further weakness in the crypto. The RSI curve is near the oversold region at 46, and a negative outlook was noted, indicating bearishness in the crypto. The MACD indicator also persisted to form red bars, and a bearish crossover was noted, which signals corrective moves.
Summary
Bitcoin SV crypto price technical oscillators also support the bullish trend. MACD, RSI, and EMA all demonstrate positive signals, suggesting that the uptrend is likely to continue. On the 1-day time frame, price action suggests investors and traders are bullish. There is a bullish perspective reflected in the price action at the moment. However, investors and traders should avoid FOMO by waiting for proper setups before moving forward.
Technical Levels
Support Levels: $48.40 and $44.06.
Resistance Levels: $56.29 and $60.00.
Disclaimer
This article is for informational purposes only and does not provide any financial, investment, or other advice. The author or any people mentioned in this article are not responsible for any financial loss that may occur from investing in or trading. Please do your own research before making any financial decisions

Nancy J. Allen is a crypto enthusiast, with a major in macroeconomics and minor in business statistics. She believes that cryptocurrencies inspire people to be their own banks, and step aside from traditional monetary exchange systems. She is also intrigued by blockchain technology and its functioning. She frequently researches, and posts content on the top altcoins, their theoretical working principles and technical price predictions.


