
 Home
Home News
News

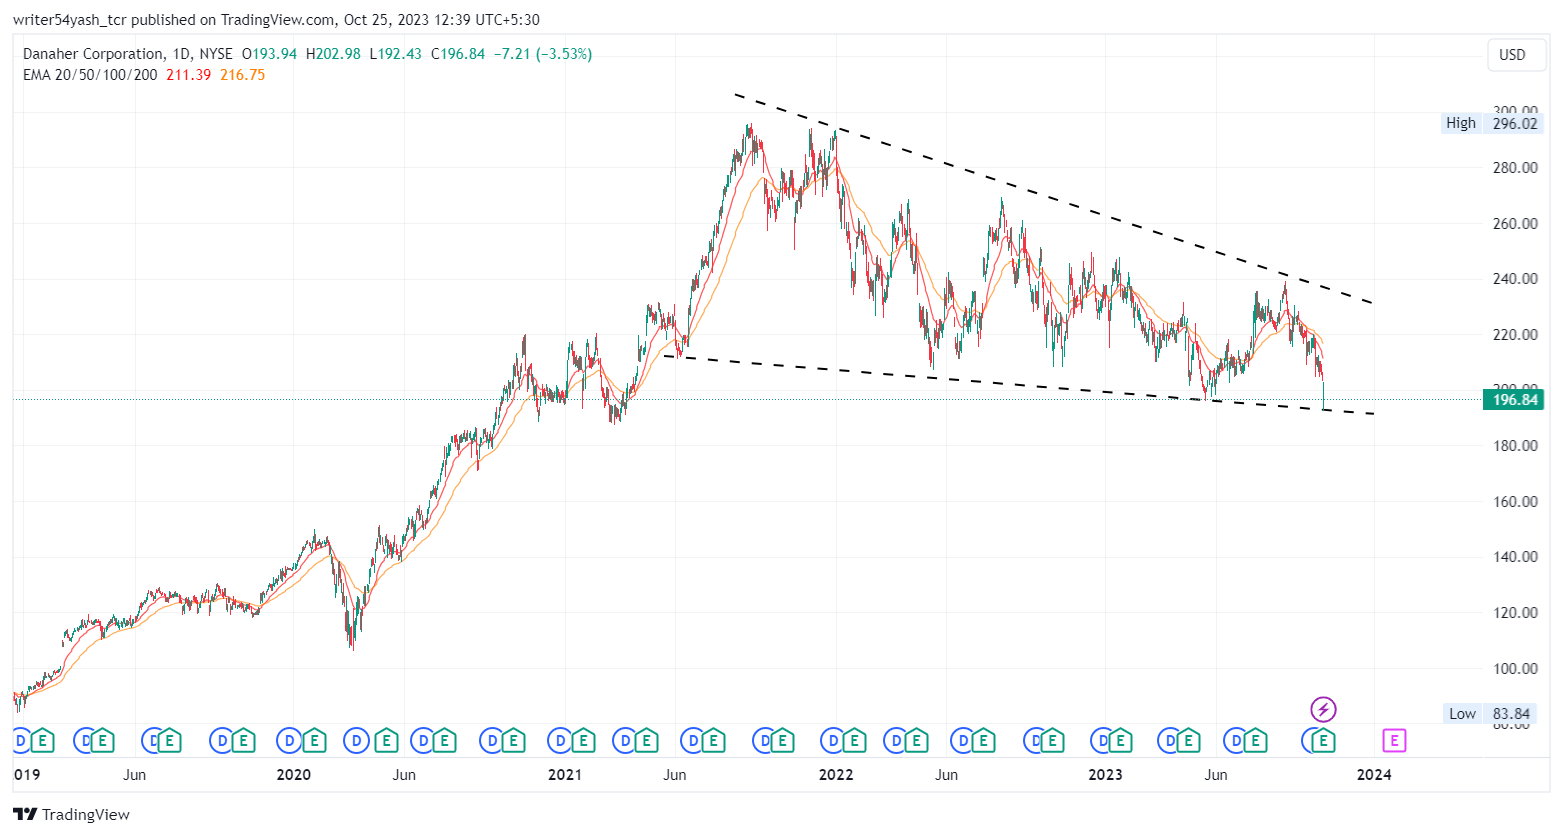
- 1 The DHR stock is converging in a narrow range and building a falling wedge pattern.
- 2 Danaher Corporation (NYSE: DHR) stock’s current volume is above the average volume.
The Danaher Corporation (NYSE: DHR) stock has been losing value for a long time. It dropped 11.24% this month, 12.68% in three months, and 4.66% in six months. Moreover, it also lost 17.08% since the start of the year and 10.02% last year. The stock never reached a new high in the past year.
The DHR stock’s income statement highlights that the revenue did not change in the last two quarters, but the profit margin and the net income went down a lot. This means that the company is not performing well compared to other companies in the medical specialties industry. This might be one of the reasons the stock price is low on the chart.

However, on analyzing DHR stock price’s past history on the chart, it was observed that on March 2020. It showed the most abrupt buying in the stock around the $83 support level. This led DHR price to $296 which is almost a 4x gain by September 2021.
However, resistance was faced at the high, and stock failed to continue its upward break of structures. As profit booking was taken by investors, that they had accumulated in the last couple of years and the DHR stock failed to recover and made new lows on every attempt.
As per the past history of the price on the chart, it seems that the stock rose when the pandemic started as the company was of medical specialty and health technology. The company was expected to develop a vaccine and provide aid to many.
On this theory, the investors might have invested in the stock considering it as the best time to buy, they bought it abruptly and one saw a surge in price.
However, the price faced resistance and started to drop when the virus was eradicated and people moved on with their lives. Furthermore, it seems like the investors might have seen it coming and waited eagerly for the good time to book profits. They began right after September 2021 and a decline was observed in the stock price.
As far as the price action has performed in the last couple of years over the charts, it seems that the uptrend has been switched to a downtrend in the last two years and the stock price is trapped in a converging range as a falling wedge pattern.
If the price sustains and does not fall more, then it may reverse and give a breakout, but since the above hurdles seem to be strong it is below all major EMA’s.
It is presumed that if volume does not show momentum, the price will not give a breakout and end up consolidating or stretching the wedge pattern more downwards by making more lower lows wicks.
Moreover, DHR had seen setbacks in price and consistent selling pressure and could not overcome them over time. It showed underperformance by declining downwards in the last two years.
Therefore, if DHR fails to manage current levels, it would be hazardous to the stock price and drag the price downwards and the possible support would be $188 and $170.
Alternatively, if the stock shows upward strength and surpasses the previous swing high then, the possibility for the stock to become bullish increases. Otherwise, the resistances that might kick it back would be $220 and $233.
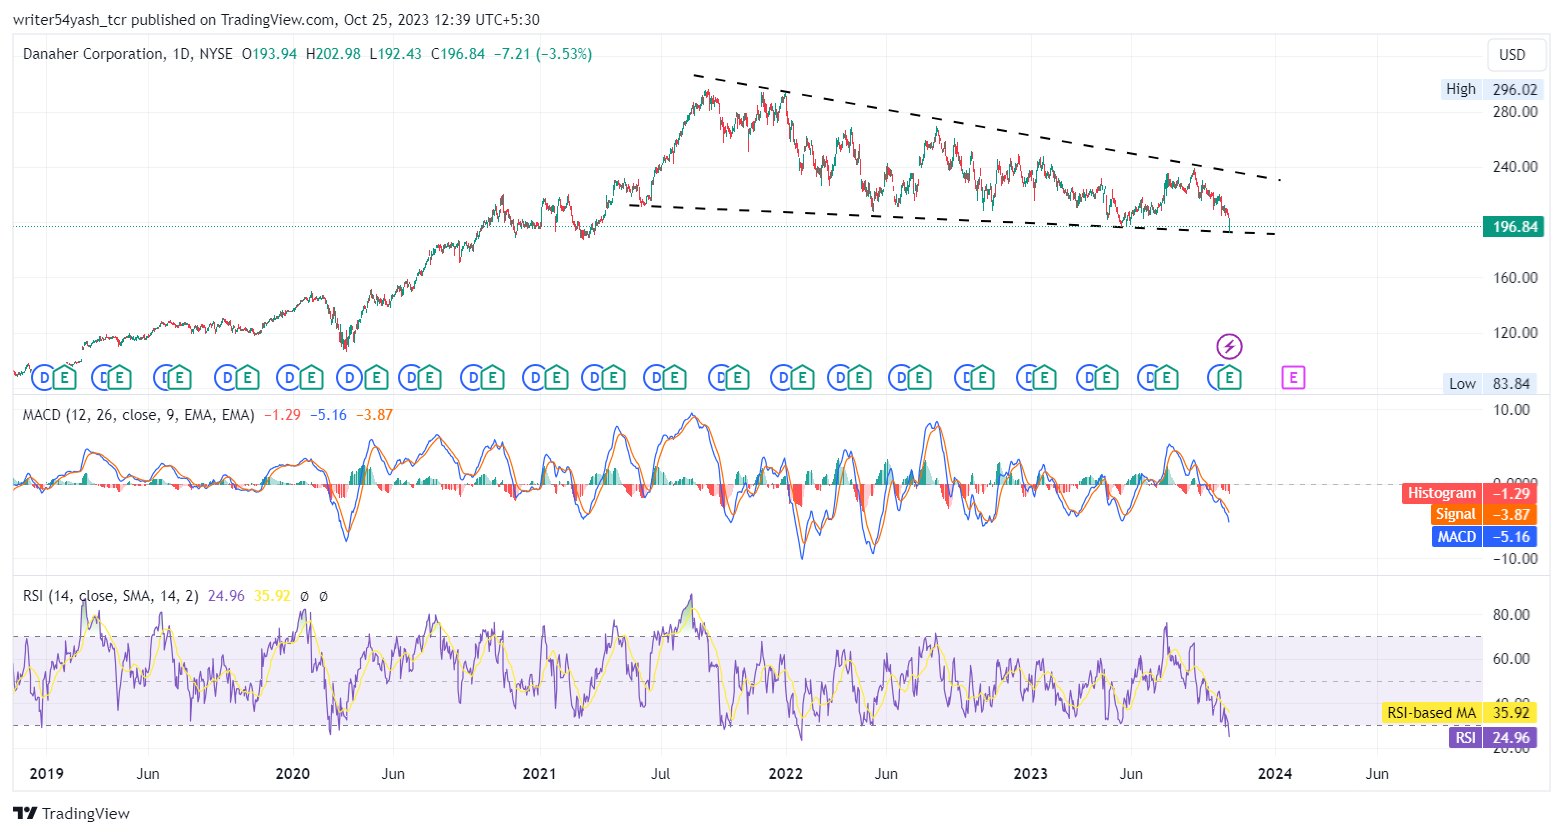
Major technical tools such as RSI, MACD, and EMA together highlight bearish outlooks at the time of publishing.
What Do We Have Here in DHR Price History?
Summary
The price action shows a lower highs and lows formation and rejection being faced by the downward trendline in DHR stock. It is showing signs of a more bearish outlook at the time of publishing, also the price is converging in a falling wedge as well. The technical analysis tools of the Danaher Corporation stock price highlight downward signals and support bearishness.
Moreover, the Danaher Corporation (NYSE: DHR) chart indicates that the traders and investors of the share price are bearish and negative on the 1-D timeframe.
Technical Levels
Support Levels: $188 and $170
Resistance Levels: $220 and $233
Disclaimer
In this article, the views, and opinions stated by the author, or any people named are for informational purposes only, and they don’t establish the investment, financial, or any other advice. Trading or investing in cryptocurrency assets comes with a risk of financial loss.
Steve Anderson is an Australian crypto enthusiast. He is a specialist in management and trading for over 5 years. Steve has worked as a crypto trader, he loves learning about decentralisation, understanding the true potential of the blockchain.


