
 Home
Home News
News

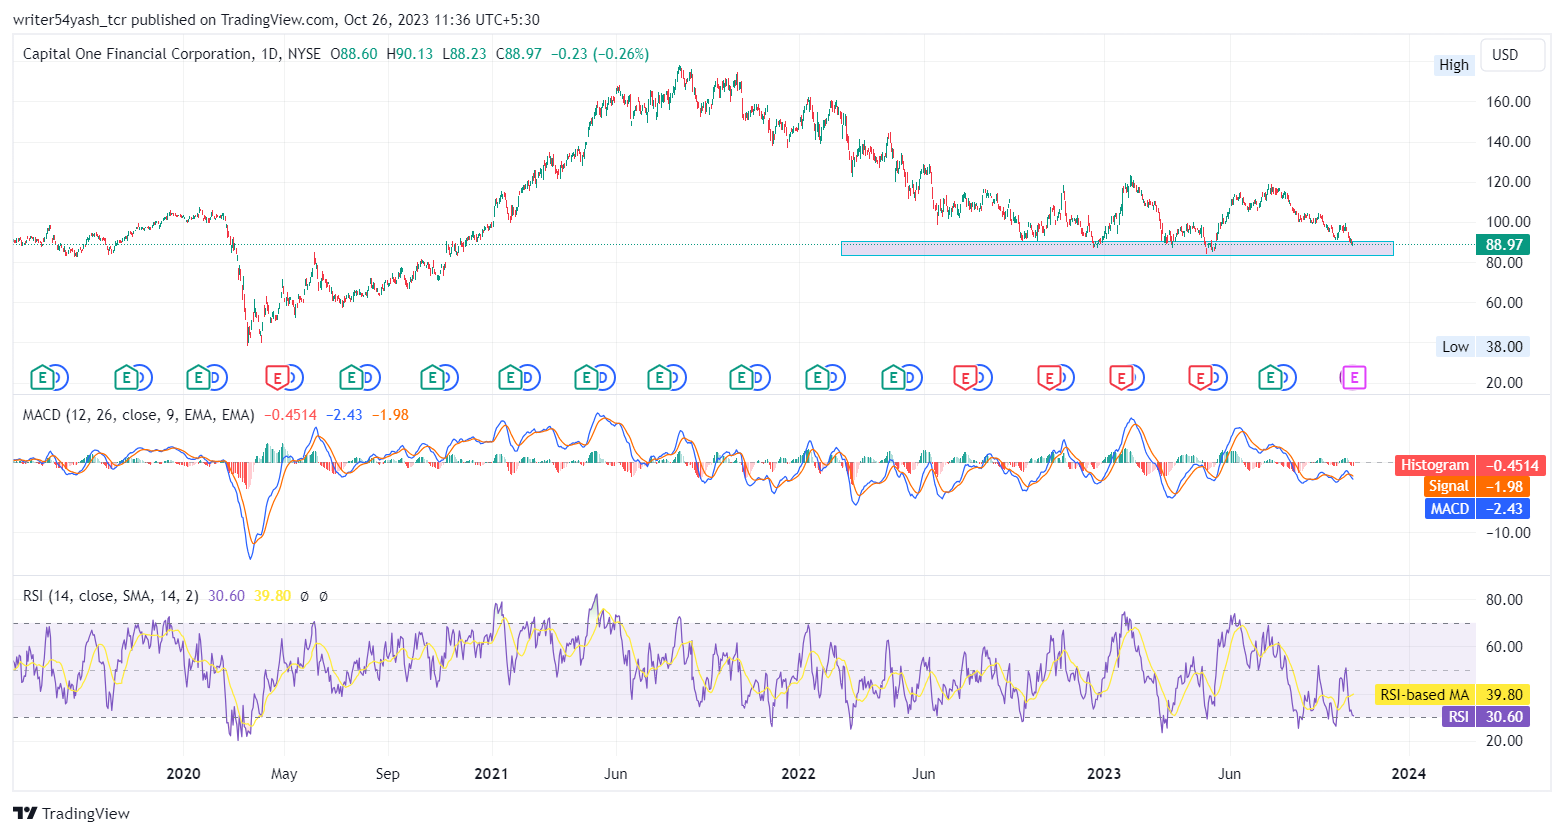
- 1 The COF stock shows weakness over the chart with bulls barely managing the level.
- 2 The short sellers are giving bulls a heavy beating as the stock is unable to surge above the demand zone.
Capital One Financial Corporation (NYSE: COF) stock price is struggling to survive on the chart as the key moving averages as short sellers trying their best to push the stock down. COF stock price is currently stuck below the 20 and 50 EMA levels around the demand zone by making lower lows and highs.
COF stock is currently trading at the level of $88.97 with an intraday loss of 0.26% which showcases bears trying to overpower the bulls. But it is a difficult task for bears right now as the bulls do not want to lose their grasp so easily as it is trading near a major demand zone.

COF stock is currently trading with an intraday volume of 2.37 million and the average trading volume of the stock is 2.22 Million. The market cap of the company is $33.937 Billion and the company gave a dividend yield of 2.69%. The price-to-earnings ratio of the company is 6.83 with a basic EPS of $13.10 and a share float of 376.31 Million shares.
According to the Capital One Financial Corporation (NYSE: COF) chart, the stock price has been rising since March 2020. From here, COF rallied from the $38 support level by making higher highs and lows and reached $177 in August 2021.
But at the high, it faced resistance as investors took profit booking which caused rigourous selling pressure over the chart. Somehow, the COF stock is managing to trade in a major demand zone.
Therefore, if COF stock fails to hold the current level and continuously declines below and breaches below $84, it may go up to $76 as well. On the contrary, if buyers boost, only then, the COF stock might spike upwards strongly from the current level and ascend. The possible targets are between $98 and $105.
Currently, COF stock is trading below the 20 and 50-day exponential moving averages, which are rejecting the price momentum. The current value of RSI is 30.60 points. The 14 SMA is below the median line at 39.80 points which indicates that the COF stock is bearish.
The MACD line at 2.43 and the signal line at 1.98 are below the zero line. A bearish crossover is observed in the MACD indicator which signals weakness in the momentum of the stock price.
Will Demand Zone Push COF Price Up or Bears Take Control?
Summary
The technical analysis tools of the Capital One stock price highlight downward signals and bearish signals. Capital One Financial Corporation (NYSE: COF) chart indicates that the traders and investors of the share price are showing bearish movement on the 1-D timeframe. The price action shows that it is trading near the demand zone. If more selling joins the stock, it might break the demand zone as well.
Technical Levels
Support Levels: $84 and $76
Resistance Levels: $98 and $105
Disclaimer
In this article, the views, and opinions stated by the author, or any people named are for informational purposes only, and they don’t establish the investment, financial, or any other advice. Trading or investing in cryptocurrency assets comes with a risk of financial loss.
Mr. Pratik chadhokar is an Indian Forex, Cryptocurrencies and Financial Market Advisor and analyst with a background in IT and Financial market Strategist. He specialises in market strategies and technical analysis and has spent over a year as a financial markets contributor and observer. He possesses strong technical analytical skills and is well known for his entertaining and informative analysis of the Financial markets.


