
 Home
Home News
News
- 1 GIS stock price indicates a rebound from the support zone of $60.
- 2 Buyers are gaining traction and are looking to surpass the 50 day EMA.
General Mills Inc. (NYSE: GIS) stock has gained momentum and exited the falling parallel channel. Furthermore, the price action shows that GIS stock rebounded from the bottom zone of $60. GIS stock surpassed the 20 day EMA aggressively and made a strong bullish engulfing candlestick showcasing strong buying interest. The stock price is close to the 50 day EMA which if surpassed, fresh bullish moves are expected.
GIS stock price has surpassed the 38.2% Fibonacci retracement zone and is heading to the 50% zone near $72. Furthermore, the sellers are covering their short positions. Per the options chain, at the strike price of $65, open interest of 252 hundred shares on the call side, whereas 22 hundred shares on the put side, signifying the short covering move in yesterday’s trading session.
At press time, GIS stock price was $65.65 with an intraday gain of 3.14%. Moreover, the trading volume increased by 1.43% to 5.30 Million while the market cap was $38.161 Billion. However, analysts maintained a neutral rating with a yearly target price of $70.48 suggesting that volatility may continue in the upcoming sessions.
General Mills, Inc. engages in the manufacture and marketing of branded consumer foods sold through retail stores. Its product categories include snacks, ready-to-eat cereal, convenient meals, pet food, refrigerated and frozen dough, baking mixes and ingredients, yoghurt, and ice cream. The firm operates through the following segments: North America Retail, International, Pet, and North America Foodservice. The North America Retail segment includes grocery stores, mass merchandisers, membership stores, natural food chains, drug, dollar and discount chains, convenience stores, and e-commerce grocery providers. The company was founded by Cadwallader C. Washburn on June 20, 1928 and is headquartered in Minneapolis, MN.
Will GIS Stock Extend Pullback Above 50 Day EMA?
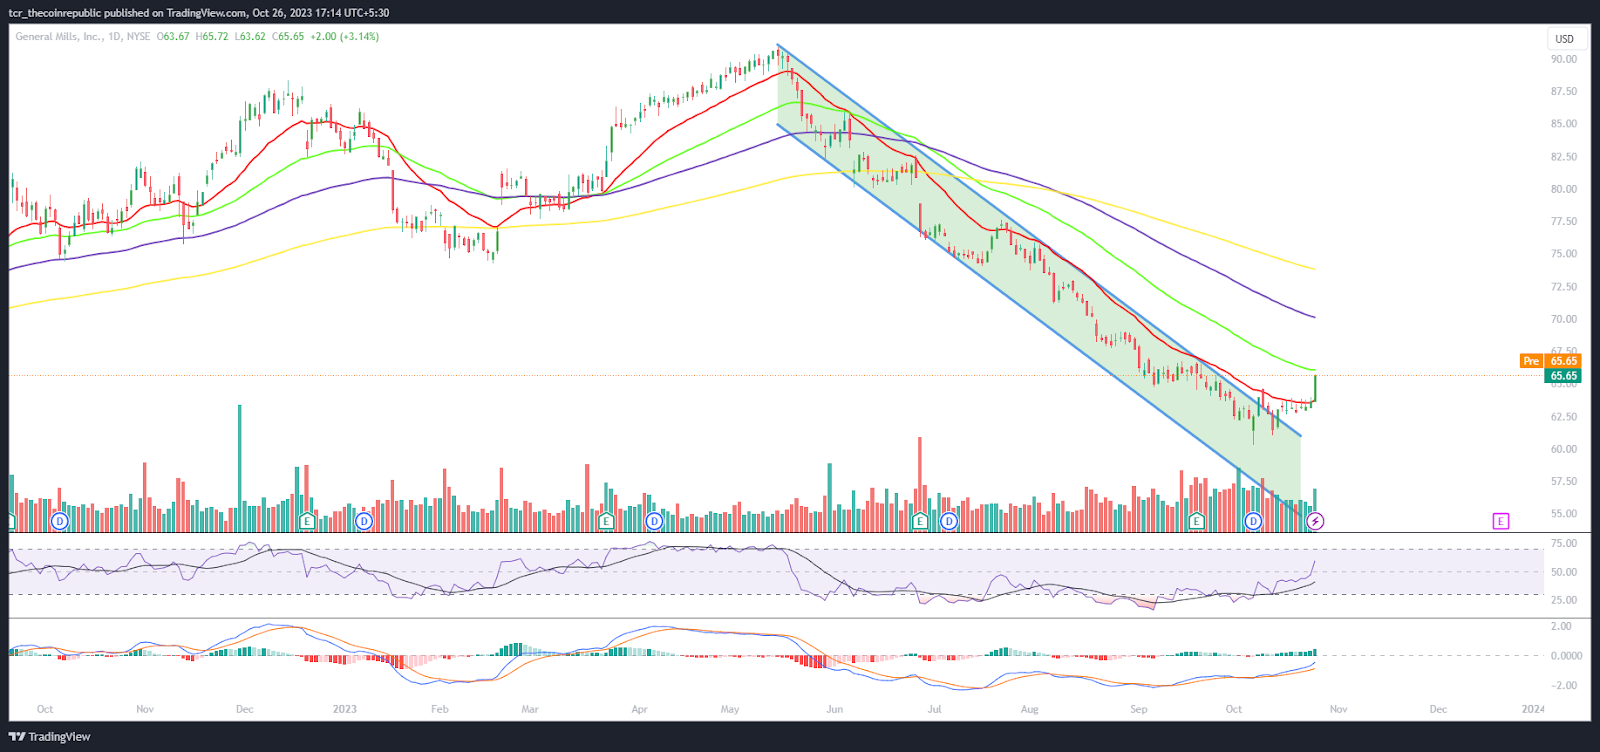
On the daily charts, GIS stock price is above the 20 day EMA and is heading towards the 50 day EMA. It formed a strong bullish candlestick in yesterday’s trading session. Moreover, the price action shows that buyers could retest the $75 level near the 200 day EMA. Furthermore, the chart showcased a channel breakout while GIS stock initiated a fresh up move and trapped the bears.
The RSI curve is in the overbought zone and formed a bullish divergence indicating that follow on buying will continue in the upcoming sessions. The MACD indicator shows a bullish crossover and green bars on the histogram suggesting a positive outlook.
Summary
GIS stock has surpassed the 20 day EMA and is close to the 50 day EMA, highlighting the buying interest. Moreover, the short covering data indicates that follow-on buying will continue and that GIS stock may surpass the 50 day EMA followed by 100 day EMA in the upcoming sessions. Conversely, if any there’s a rejection at the 50 day EMA, GIS stock may retest the lows of $60.
Technical Levels
Support Levels: $60 and $50
Resistance Levels: $68 and $75
Disclaimer
The views and opinions stated by the author or any other person named in this article are for informational purposes only and do not constitute financial, investment, or other advice. Investing in or trading crypto or stocks comes with a risk of financial loss.

Andrew is a blockchain developer who developed his interest in cryptocurrencies while pursuing his post-graduation major in blockchain development. He is a keen observer of details and shares his passion for writing, along with coding. His backend knowledge about blockchain helps him give a unique perspective to his writing skills, and a reliable craft at explaining the concepts such as blockchain programming, languages and token minting. He also frequently shares technical details and performance indicators of ICOs and IDOs.


