
 Home
Home News
News
- 1 ITW stock price rebounded from the support zone near $215.
- 2 Buyers are looking to retest the 20 day EMA.
Illinois Tool Works Inc. (NYSE: ITW) ITW share price pulled back from the channel’s lower trendline and made a strong bullish engulfing candlestick suggesting strong buyers’ presence in the last session. However, the price action shows that ITW stock lost gains inside the falling wedge pattern and formed the lower lows sequences. Furthermore, the ITW stock price is below the significant moving averages and retested the demand zone near $215.
ITW stock price has corrected from the highs of $265. Moreover, the chart shows a double bottom pattern indicating a pullback. Per the options chain, at the strike price of $230, there was an open interest of 871 hundred shares on the call side, whereas 171 hundred shares on the put side, highlights that immediate resistance of $230.
At press time, ITW stock price was $225.97 with an intraday gain of 1.30%. Moreover, the trading volume increased by 1.22% to 2.169 Million while the market cap was $67.991 Billion. However, analysts have maintained a neutral rating with a yearly target price of $234.54.
Illinois Tool Works, Inc. engages in the manufacture of industrial products and equipment. It operates through the following segments: Automotive OEM, Test and Measurement and Electronics, Food Equipment, Polymers and Fluids, Welding, Construction Products, and Specialty Products. The Automotive OEM segment produces components and fasteners for automotive-related applications. The Test and Measurement and Electronics segment manufactures equipment, consumables, and related software for testing and measuring of materials, structures, gases and fluids. The Food Equipment segment supplies commercial food equipment and provides related services. The company was founded by Byron L. Smith in 1912 and is headquartered in Glenview, IL.
Will ITW Stock Extend the Rebound?
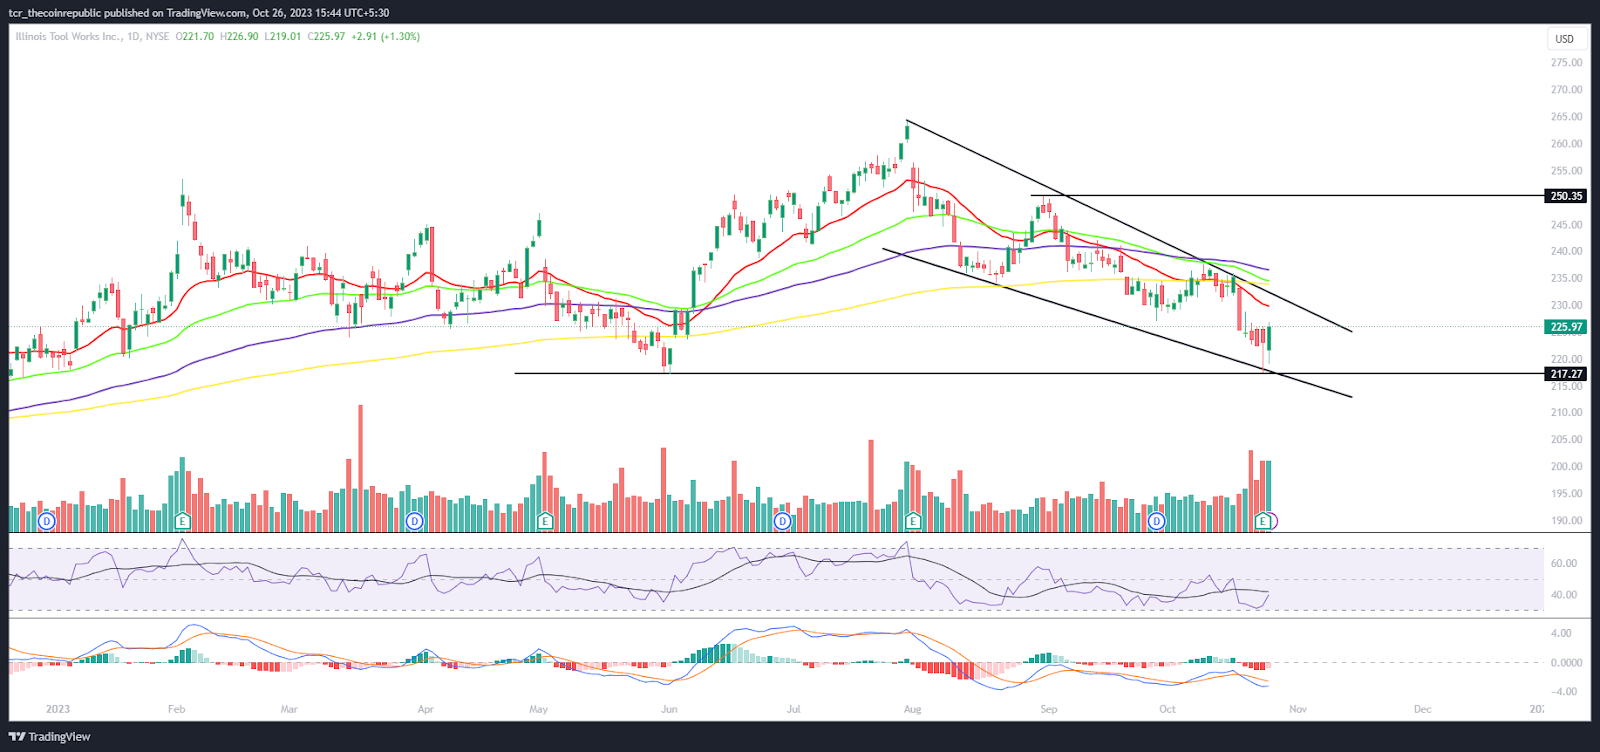
On the daily charts, ITW stock price was below the significant moving averages highlighting the bears’ dominance. Furthermore, the price action indicates that sellers persisted in adding short positions and tried to break the immediate support zone of $215. However, bulls succeeded in holding the cluster and a bullish engulfing candlestick was formed which highlights the buying interest.
The RSI curve is below neutrality and formed a negative crossover which indicates that further selling pressure is anticipated in the next sessions. The MACD indicator shows red bars on the histogram suggesting a negative outlook.
Summary
ITW stock price is retracing, but is below the significant moving averages. However, the ITW stock price has made a bullish engulfing candlestick near the support zone of $215 and showed a pullback. Furthermore, if ITW stock surpasses 20 day EMA it would lead to a reversal, and if it fails to hold the region, the round mark of $200 could be retested.
Technical Levels
Support Levels: $220 and $210
Resistance Levels: $235 and $245
Disclaimer
The views and opinions stated by the author or any other person named in this article are for informational purposes only and do not constitute financial, investment, or other advice. Investing in or trading crypto or stocks comes with a risk of financial loss.

Adarsh Singh is a true connoisseur of Defi and Blockchain technologies, who left his job at a “Big 4” multinational finance firm to pursue crypto and NFT trading full-time. He has a strong background in finance, with MBA from a prestigious B-school. He delves deep into these innovative fields, unraveling their intricacies. Uncovering hidden gems, be it coins, tokens or NFTs, is his expertise. NFTs drive deep interest for him, and his creative analysis of NFTs opens up engaging narratives. He strives to bring decentralized digital assets accessible to the masses.


