
 Home
Home News
News
- 1 The technical analysis tools for the Nucor stock price highlight upward signals.
- 2 Nucor Corporation (NYSE: NUE) stock price is showing bullishness on the daily time frame.
The Nucor Corporation (NYSE: NUE) is a non-energy minerals company that manufactures steel-based products like steel fasteners, steel grating, steel decks, and many more.
The Nucor Company was founded in the state of North Carolina in the city called Charlotte which is now a major commercial hub of the state. The company was founded by Ransome E. Olds in 1905.

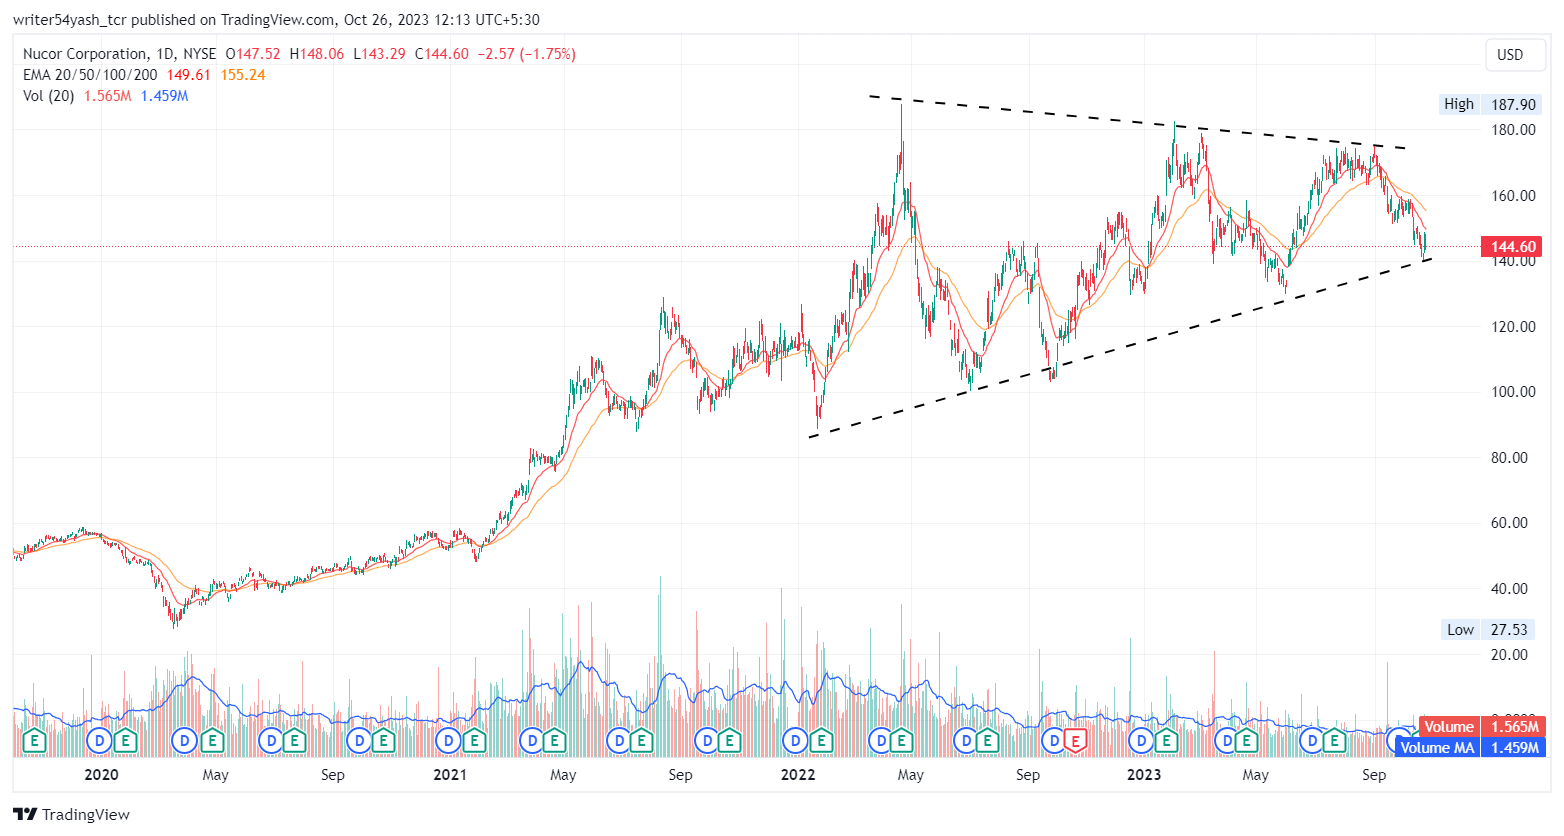
The NUE stock received a major boost in price around the time of the pandemic in the year 2020. Most of the companies got multifold buyers that year and NUE happened to be one of them.
The price eventually rallied from $27 and created a high of $187 by forming an uptrend by building higher highs and lows structures on the chart. This gave the investors more than 6x of their returns on the investments by April 21, 2022.
The same day in April 2022, the quarter earnings report came for the period ending March 2022, which invited profit booking. The profit booking done by investors led the price to form a support of around $100, from this level, the price trading movement ended up getting narrowed.
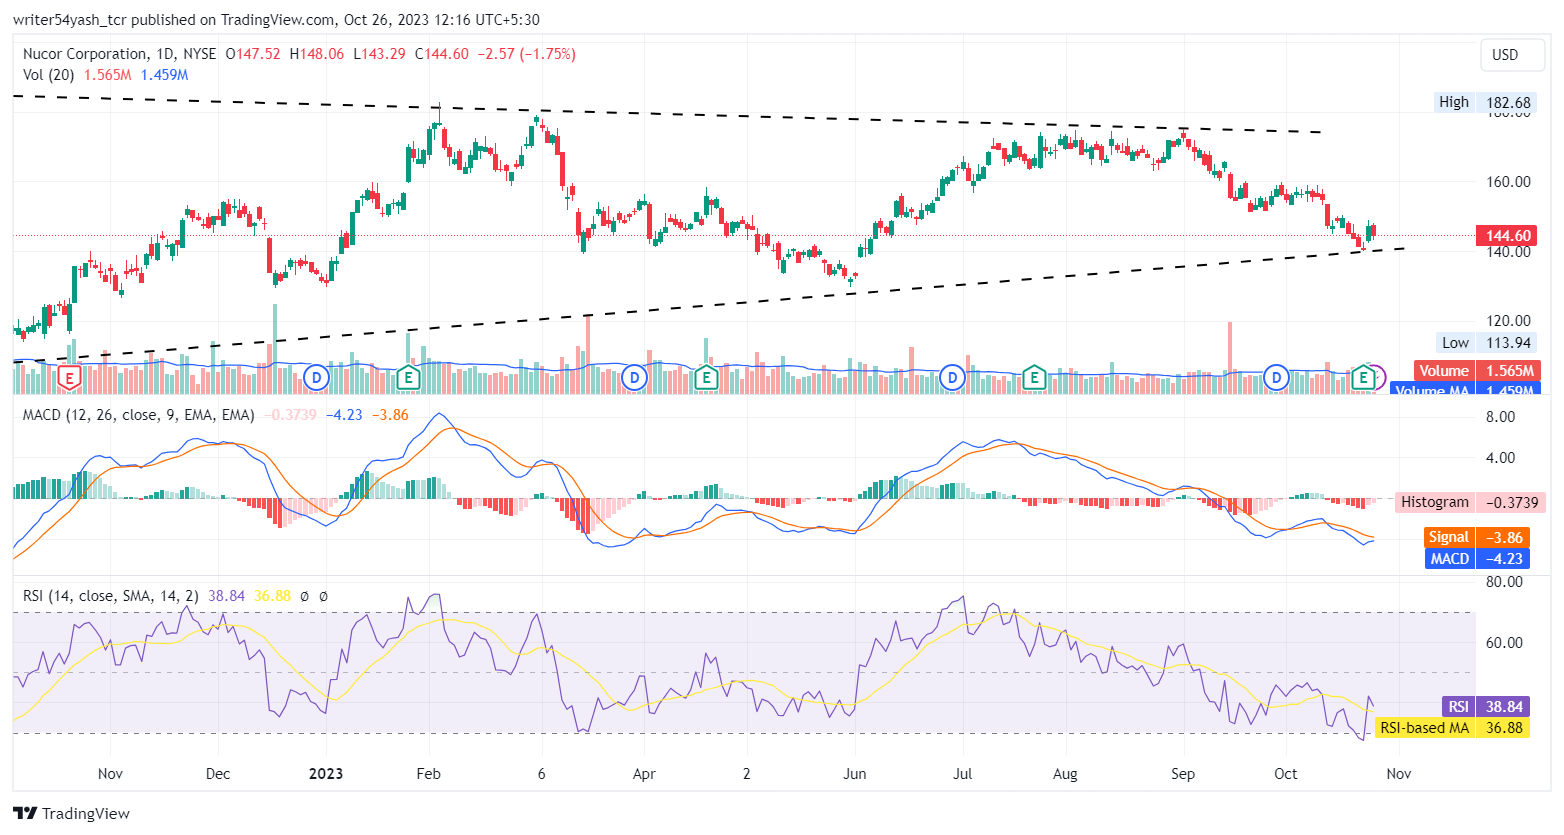
In the recent year on the chart, the stock fell 14.03% in the last three months and 2.30% in the last week. This shows that both trendlines are being followed greatly on the charts, which is leading the price to converge more.
So, the buyers and sellers are facing a tough battle, where buyers have a little bit upper hand. If either of them loses its grip then a strong rally with the momentum may be observed next.
Therefore, if buyers boost more the NUE stock might surge strongly from the current level and surge above. The possible targets are between $160 and $170.
On the contrary, if NUE stock fails to hold its grip and continuously declines and breaches below $130, it may hit $116.
Will NUE Stock Price Show a Bounce?
Currently, NUE stock is trading above upward trendline support, but trading below the 20 and 50-day exponential moving averages, which are not supporting the price at the moment.
But the stock is making an upward break of structures, which makes it seem like the bulls have the upper hand. Therefore, if buying volume adds up, then the price might persist upward with bullish momentum by making new highs and new lows.
Hence, the NUE price is expected to move upward giving a bullish overview over the daily time frame chart.
The present value of RSI is 38.84 points and the 14 SMA is beneath the median line at 36.88 points which suggests that the NUE stock is bullish.
The MACD line at 4.23 and the signal line at 3.86 are building the curves below the zero line. A bullish crossover is anticipated next in the MACD indicator.
As bullish strength in the momentum of the stock price is building up it is leading both the curves to narrow on in each other. Highlighting, the histogram width is narrowing and showing an upcoming bullish move estimated signal.
In addition, the stock ratings for NUE stock are positive and highly recommended based on 13 analysts who have evaluated the stock in the last three months. The 1-year price forecasts for stock by 8 analysts range between $151 to $185.
Summary
The stock ratings for NUE stock are positive and highly recommended based on 13 analysts who have evaluated the stock in the last three months. The price action shows a higher highs and lows formation and price converging between two trendlines and rising while converging in the NUE stock, showing gestures of a more bullish outlook at the time of publishing.
The technical analysis tools such as RSI, MACD, and EMA for the Nucor stock price highlight upward signals and support bullishness. Nucor Corporation (NYSE: NUE) chart indicates that the traders and investors of the share price are bullish and positive on the 1-D timeframe.
Technical Levels
Support Levels: $130 and $116
Resistance Levels: $160 and $170
Disclaimer
In this article, the views, and opinions stated by the author, or any people named are for informational purposes only, and they don’t establish the investment, financial, or any other advice. Trading or investing in cryptocurrency assets comes with a risk of financial loss.
Steve Anderson is an Australian crypto enthusiast. He is a specialist in management and trading for over 5 years. Steve has worked as a crypto trader, he loves learning about decentralisation, understanding the true potential of the blockchain.


