


Citigroup stock price (NYSE: C) fell approximately 12% from the recent swing high and formed a bearish pattern. It faced strong rejection from $43.00 and investors reacted negatively after the release of earnings.
C stock price continues to trade below the 50-day and 200-day EMA showcase downtrend.
Previously, buyers tried multiple times to climb above the 50-day EMA to reverse the short-term trend. But sellers were active and took the pullback as an opportunity to create fresh shorts.
Citigroup Inc. released the previous quarter earnings on October 13, 2023. It reported an EPS of $1.63 and revenue of $20.139 Billion. The company beats the EPS as well as revenue estimates by 32.88% and 4.50% respectively.
Despite that, the C stock price reacted negatively and hurt the investors’ sentiments. However, the share price has corrected a lot in the last few months. So, a narrow range consolidation is expected before deciding the next direction.
C stock price is trading near the April 2020 lows so the price looks highly oversold. Therefore, it will be risky for short sellers to create further shorts.
When Will Downfall in Citigroup Stock Price Take A Halt?
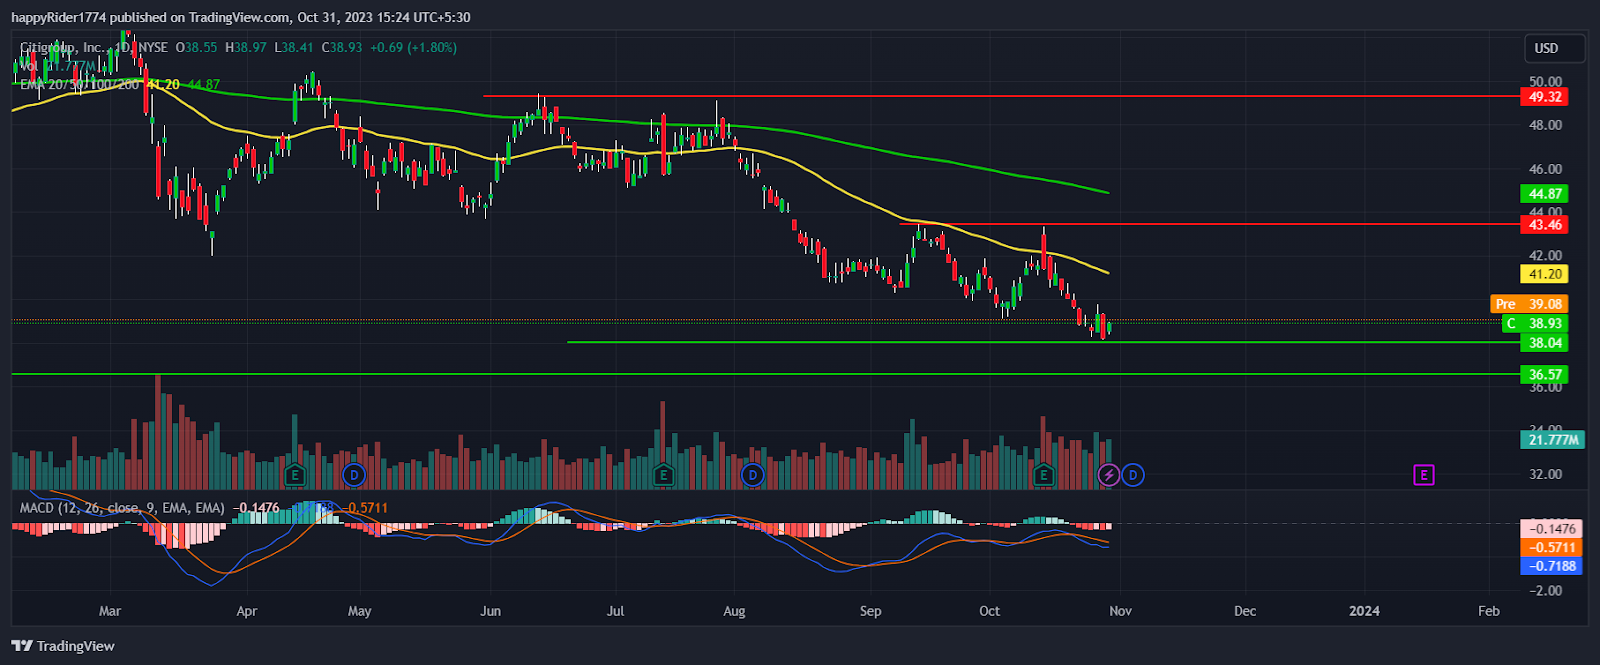
Citigroup price is on the sellers’ radar and bears look more active as compared to bulls. Till the share price trades below $43, the bears will remain active and pull back. They will face difficulty in sustaining on higher levels.
On the lower side, $36.57 will act as an immediate support. The downfall in the C stock price may take a halt near support and might show a term rebound.
However, if the situation gets worse and the price slips below $36.57, then the stock may test the 2020 lows which stands at $32.
C Stock Price is in the Correction Phase
C stock price is in a correction phase and displaying a bearish pattern on a multiple time frame chart.
The broader market indices like the S&P 500, Nasdaq Composite, and Dow Jones are all mildly bearish. So, until the broader market recovers, Citigroup stock may continue to trade with a bearish bias.
The RSI curve is reversing upward from the oversold territory indicating short-term recovery is likely. But the price action is still bearish and denotes weakness.
Conclusion
Citigroup stock price (NYSE: C) fell approximately 12% from its swing high. The recent downfall was triggered after the release of quarter earnings. So, it seems like investors are disappointed with earnings.
The analysis suggests that a downfall in C stock price might take a halt near $36.57 and the price may enter consolidation.
Technical Levels
- Resistance levels: $43.46 and $44.87
- Support levels: $38.04 and $36.57


