
 Home
Home News
News
- 1 Exxon’s stock price is currently trading at $107.58 with a drop of -1.22% in the last 24 hours and a current market cap of $431.781 Billion.
- 2 XOM stock price decreased by -1.02% over the past seven days.
Exxon Mobile Corp. stock price is facing strong bearish pressure on the daily technical charts, as it is trading below the 100 and 200-day EMA. The stock has failed to break above its key resistance levels near the EMAs in the past few months, despite several attempts by the buyers.
The stock is currently trading near $107.78, with a marginal loss of 1.22% in the intraday session. The stock has a potential upside target of $110.25, but it needs to overcome the bearish momentum and surge above the 200-day EMA. The stock has a support level of $104, which could prevent further downside.

Exxon’s price prediction suggests that the stock is in the firm grip of the bears and needs to show some signs of reversal before confirming a bullish trend.
The technical indicators favor the bears projecting a pessimistic perspective for the buyers. RSI and stochastic RSI oscillators are moving near the overbought zone whereas the major EMA lines are acting as barrier points for XOM price.
The company’s performance has been dismal throughout the year. It has suffered negative returns of 1.82% in the year-to-date period, 2.46% in the last six months, nominal gain of 0.13% in the last month, and 1.02% in the last week. This shows a persistent bearish trend that has not reversed yet.
Technical Analysis of Exxon Stock Price in 1-D Timeframe
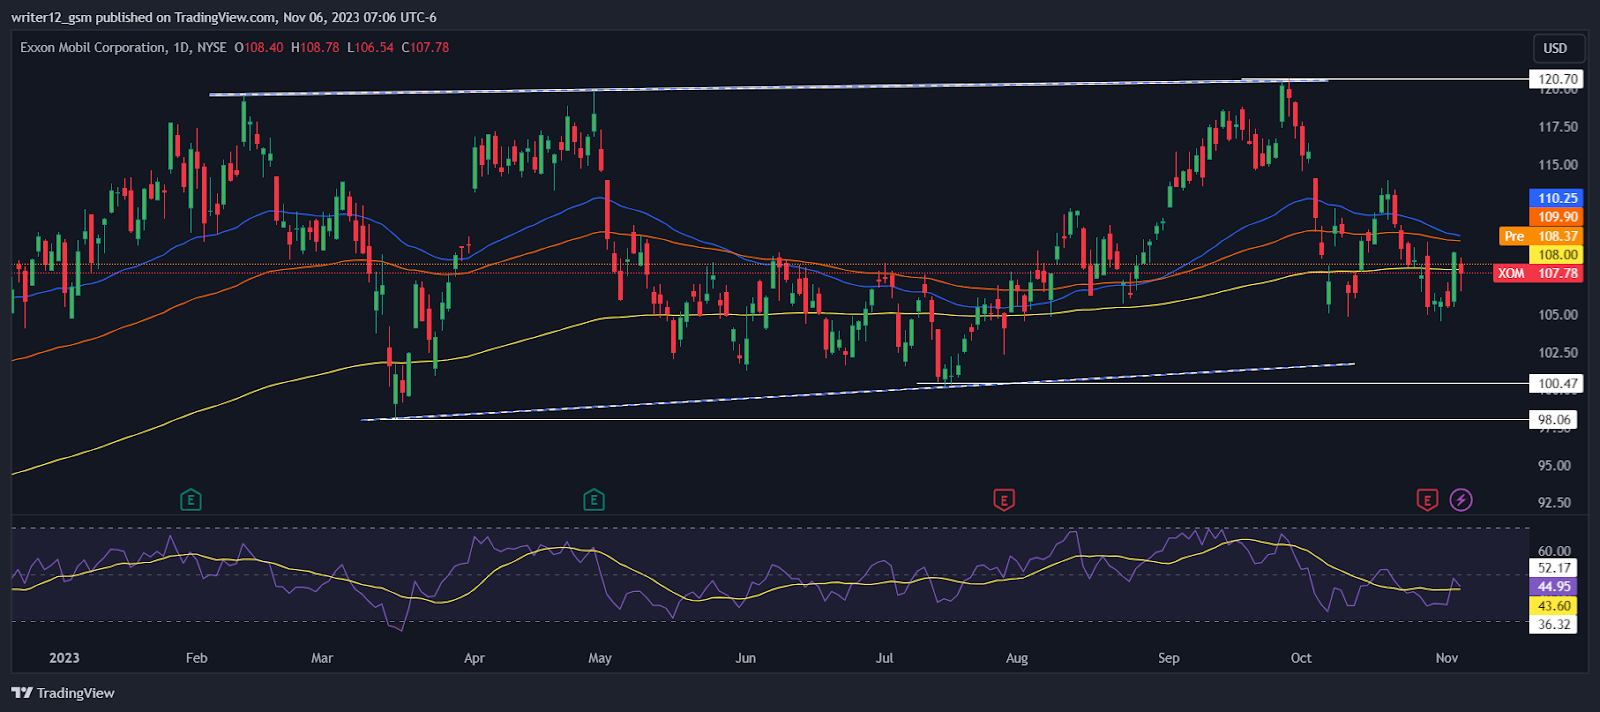
Exxon stock (NYSE: XOM) is trading under the 50 and 200-day DMAs (daily moving averages), which are not upholding the price trend.
The current value of RSI is 44.95 points. The 14 SMA is above the median line at 43.60 points which indicates that the Exxon stock is bearish.
The MACD line at -1.48 and the signal line at -1.42 are above the zero line. A bearish crossover is observed in the MACD indicator which signals more bearishness for the XOM stock price.
Weekly-Time Horizon Analysis
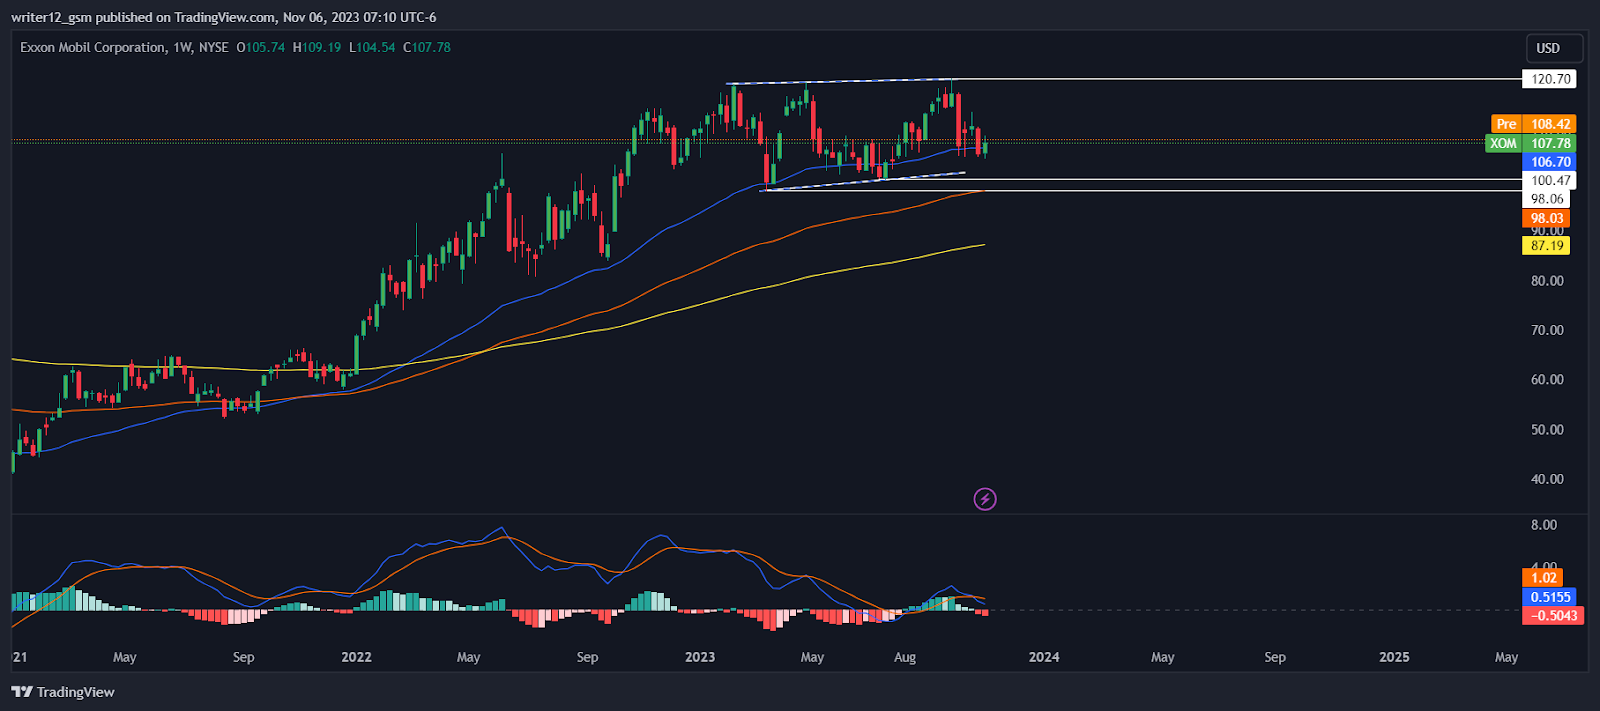
The weekly charts of Exxon stock reveal that the buyers have been dominant. The stock has been on an upward trend, as it has trading above the key EMAs. The technical indicators also confirm the bullish sentiments, as the RSI is near the neutral zone at 48 and the MACD has formed red bars and a bearish crossover. These signals indicate that the stock may face more downside pressure in the coming weeks.
Summary
Exxon Mobile Corp. stock (NYSE: XOM) technical oscillators support the bearish trend. The MACD, RSI, and EMA are emphasizing negative signs and imply that the downtrend may continue in the XOM stock price. Exxon’s price action suggests that the investors and traders are bearish on the 1-D time frame. The price action reflects a bearish perspective at the moment.
Technical Levels
Support Levels: $105.00 and $100.00
Resistance levels: $108.00 and $110.00
Disclaimer
This article is for informational purposes only and does not provide any financial, investment, or other advice. The author or any people mentioned in this article are not responsible for any financial loss that may occur from investing in or trading. Please do your own research before making any financial decisions.

Adarsh Singh is a true connoisseur of Defi and Blockchain technologies, who left his job at a “Big 4” multinational finance firm to pursue crypto and NFT trading full-time. He has a strong background in finance, with MBA from a prestigious B-school. He delves deep into these innovative fields, unraveling their intricacies. Uncovering hidden gems, be it coins, tokens or NFTs, is his expertise. NFTs drive deep interest for him, and his creative analysis of NFTs opens up engaging narratives. He strives to bring decentralized digital assets accessible to the masses.


