
 Home
Home News
News
- 1 TJX stock showcased buying interest and is heading to $100.
- 2 Buyers are showing their dominance and registered a breakout.
TJX Companies (NYSE: TJX) TJX stock registered a flag pattern breakout and has surpassed the trendline barrier of $90 in the past sessions. Furthermore, the price action showcased the buying momentum and is trading above the significant moving averages. Moreover, the chart showcased the double bottom pattern and a rebound from the support zone of $87.
TJX stock price is ready to reach the round mark of $100 and if it happens, a sharp rise toward $120 is anticipated in the coming sessions.
The TJX Cos., Inc. engages in the retail of apparel and home fashion products. It operates through the following business segments: Marmaxx, HomeGoods, TJX Canada, and TJX International. The Marmaxx segment sells family apparel including apparel, home fashions, and other merchandise. The HomeGoods segment offers an assortment of home fashions, including furniture, rugs, lighting, soft home, decorative accessories, tabletop and cookware as well as expanded pet, kids, and gourmet food departments. The company was founded by Bernard Cammarata in 1962 and is headquartered in Framingham, MA.
TJX stock chart shows buying action with a gap up ahead of the Q3 earnings results, which is a positive sign. Additionally, the investors are showing their willingness and do fresh buying to attain delights earlier as possible. Amid the weak global sentiments, TJX stock was in a strong uptrend and continued to reward its investors. TJX surged over 25% in the last three months under bullish dominance.
Will TJX Stock Reach the $100 Mark ?
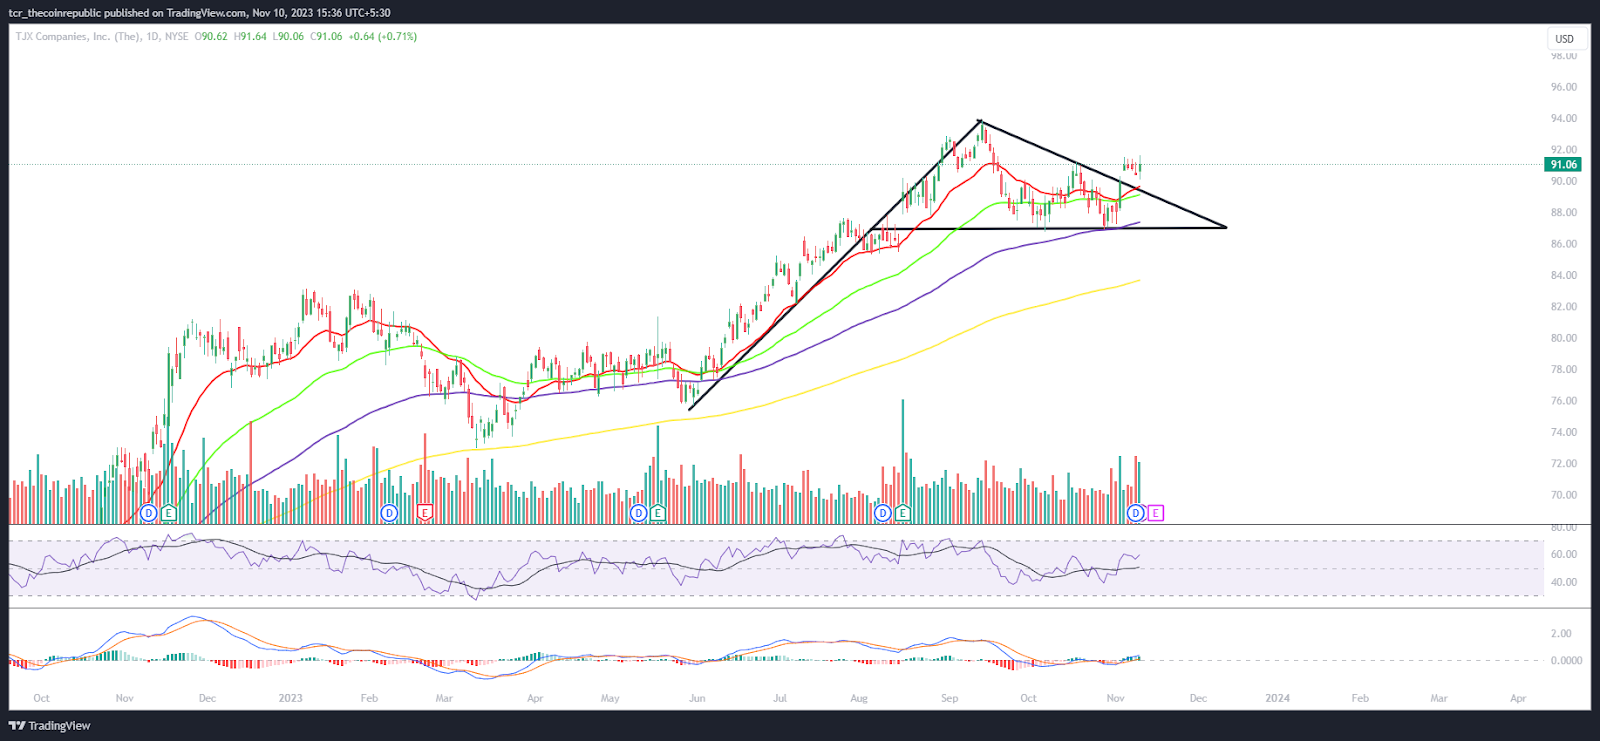
On the daily chart, TJX stock price is trading in a bullish trajectory. Moreover, the price action showcased the buyers’ accumulation. Furthermore, the stock is trading close to its 52 week highs of $93.78.
At press time, TJX stock price is trading at $91.06 with an intraday gain of 0.71% showing neutrality on the charts. Moreover, the trading volume increased by 1.78% to 7.80 Million while the market cap is $104.18 Billion. Analysts have maintained a buy rating with a yearly target price of $100.16, suggesting a growth outlook.
TJX stock is approaching the 52 week high as the buyers broke out of the flag pattern giving signs of extending the rally. Furthermore, the options chain shows long build up activity, favoring the bulls.
The RSI curve is in the overbought zone and formed a bullish divergence, suggesting an uptrend towards $100 soon. The MACD also suggests a positive outlook for the upcoming sessions.
Summary
TJX stock price is trading in the bullish trajectory above the significant moving averages, showing bullish dominance on the charts. Furthermore, the price action shows steady build up.
Technical Levels
Support Levels: $85 and $80
Resistance Levels: $95 and $100
Disclaimer
The views and opinions stated by the author or any other person named in this article are for informational purposes only and do not constitute financial, investment, or other advice. Investing in or trading crypto or stocks comes with a risk of financial loss.

Andrew is a blockchain developer who developed his interest in cryptocurrencies while pursuing his post-graduation major in blockchain development. He is a keen observer of details and shares his passion for writing, along with coding. His backend knowledge about blockchain helps him give a unique perspective to his writing skills, and a reliable craft at explaining the concepts such as blockchain programming, languages and token minting. He also frequently shares technical details and performance indicators of ICOs and IDOs.


