
 Home
Home News
News

- 1 Polkadot price showcased a vertical rebound from the low of $3.60.
- 2 DOT price is trading close to the supply zone of $5.70.
Polkadot (DOT) DOT price showed a V-shaped setback and has witnessed buyers’ accumulation in the past few sessions. Moreover, DOT has topped the significant moving averages amid a volume spurt. Polkadot is preparing to fly above the prompt burden of $5.70 and is keen to retest the trajectory highs of $7.00. In the past few months, DOT price lost gains inside the falling channel and retested the bottom at $3.50. Afterward, a morning star candlestick is enlisted on the base, followed by a bullish candlestick, and the reversal goes on.
DOT price has attained buying momentum and is forming higher highs inside the rising parallel channel. Amid the sellers’ attempt to bring DOT downwards, buyers did not lose their grip and tightened the gains decisively. After that, sellers failed to do so and started covering their short positions and stayed on the back foot.

The live price of DOT is $5.524 with an intraday gain of 2.22%, showing neutrality on the charts. Moreover, the trading volume increased by 4.76% to $371.76 Million, and the market cap is $7.33 Billion. The pair of DOT/BTC is at 0.000151 BTC. However, analysts have maintained a technical buy rating, suggesting a significant rise in the coming sessions.
Will DOT Register a Breakout Above $5.80?
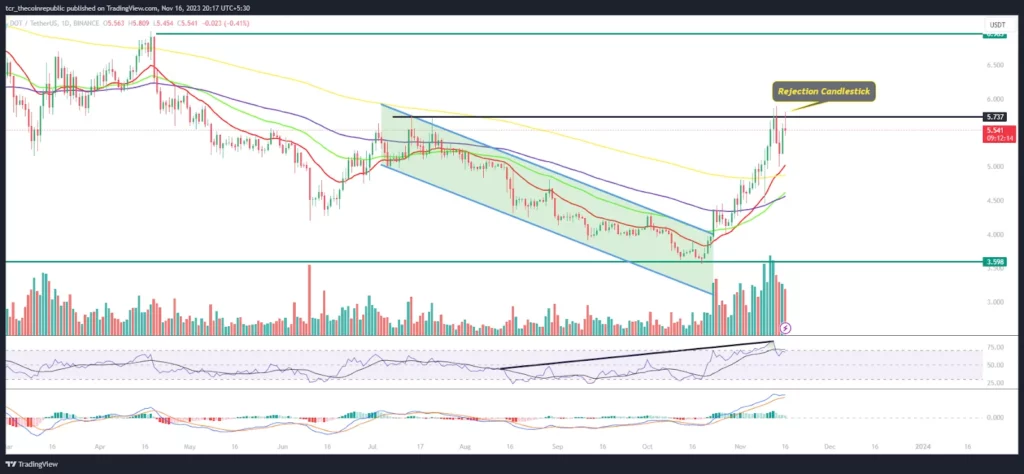
On the daily charts, the DOT price is switching above the key moving averages and has showcased a relapse in the past sessions. Moreover, the price action witnessed fresh buying interest, and the DOT price was near the critical neckline of $5.70, which acted as a vital resistance zone. Additionally, a rejection candle named ‘inverted hammer’ was formed there, and sellers are trying their best to save the cluster. DOT price has recovered from the 38.2% Fibonacci retracement zone and has now reached the 50% zone close to the upper bollinger band.
The RSI curve stayed in the overbought zone and formed a positive divergence, which indicates that the DOT price will continue to extend the gains and soon reach $7.00.
The MACD indicator showed a bullish crossover and persisted in forming green bars on the histogram, suggesting a bull rally for the upcoming sessions.
Summary
Polkadot price is trading close to the make-or-break level of $5.70, which, if surpassed, would lead to a sharp rise up to $6.00, followed by $7.00. Conversely, if it fails, it will slip to the 20-day EMA mark near $5.00. Additionally, the battle is favoring the bulls and suggesting that DOT will continue to outperform and soon reach the blue skyzone above $7.00.
Technical Levels
Support Levels: $5.20 and $5.00
Resistance Levels: $6.00 and $6.20
Disclaimer
The views and opinions stated by the author or any other person named in this article are for informational purposes only and do not constitute financial, investment, or other advice. Investing in or trading crypto or stocks comes with a risk of financial loss.

Andrew is a blockchain developer who developed his interest in cryptocurrencies while pursuing his post-graduation major in blockchain development. He is a keen observer of details and shares his passion for writing, along with coding. His backend knowledge about blockchain helps him give a unique perspective to his writing skills, and a reliable craft at explaining the concepts such as blockchain programming, languages and token minting. He also frequently shares technical details and performance indicators of ICOs and IDOs.


