
 Home
Home News
News
- 1 ATOM crypto price is currently trading at $9.438 with a rise of 0.61% in the last 24 hours with a current market cap of $3.545 Billion.
- 2 Cosmos crypto price is trading above the key moving averages, showing bullishness on the chart.
The price of Cosmos is trading above in the bullish zone showcasing bullishness. The 24-hour volume of the crypto is 117.094 Million. ATOM has a market capitalization of 3.545 Billion. Its price has seen a slight decline of about 1.00% over the past week and an excellent gain of 47.28% over the past month.
However, crypto has gained by about 25.11% over the past three months and lost by about 10.31% over the past six months. Its performance throughout the year has also been disappointing, with a year-to-date return of about 0.96%.
What Technical Indicators Say of ATOM Crypto?
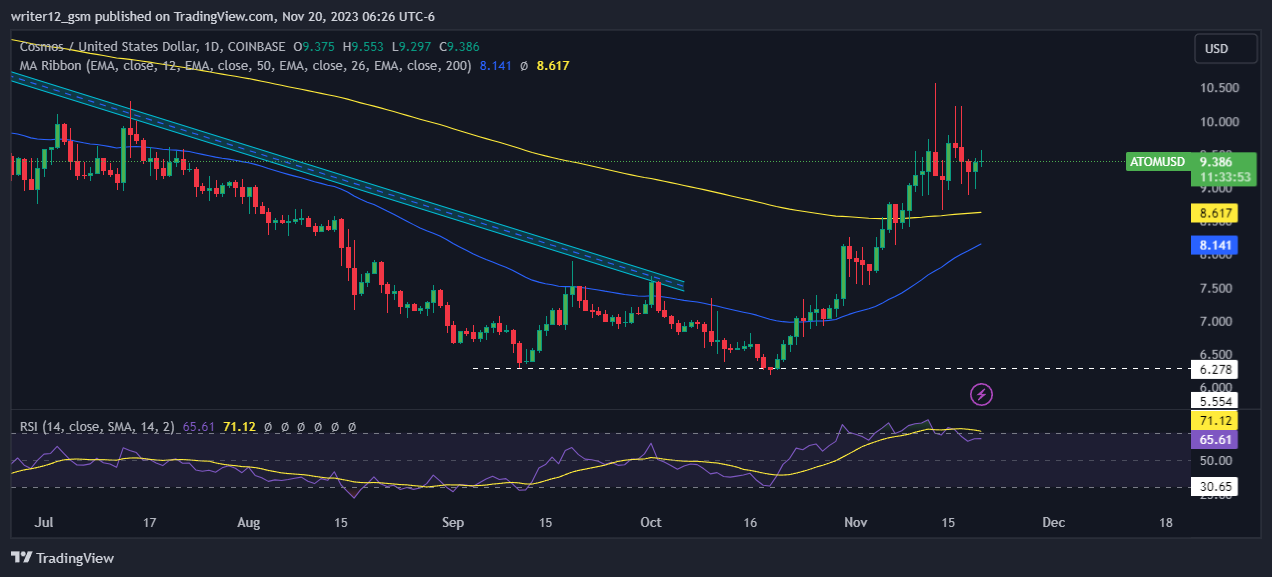
ATOM crypto is displaying strong bullish momentum as its crypto price has moved above the 50-day and 200-day moving averages. Cosmos crypto price could begin a new upward trend and climb higher if the buying demand persists. Moreover, the bullish signal on the daily chart confirms the positive outlook.
The technical indicators of Cosmos crypto are showing strong bullish signals. MACD, RSI, and super trend support the crypto. The MACD line is trading above the signal line, indicating bullish momentum. The RSI is above 66.12, showing a positive momentum. The super trend line is below the price, ensuring an upward trend. These indicators suggest that ATOM crypto is in a powerful bullish trend and may continue to rise.
On the Weekly charts, Cosmos crypto is close to a critical breakout. It occurs when the price trades above 50 EMA. However, buyers are accumulating the crypto by defending it from the support of $9.00.
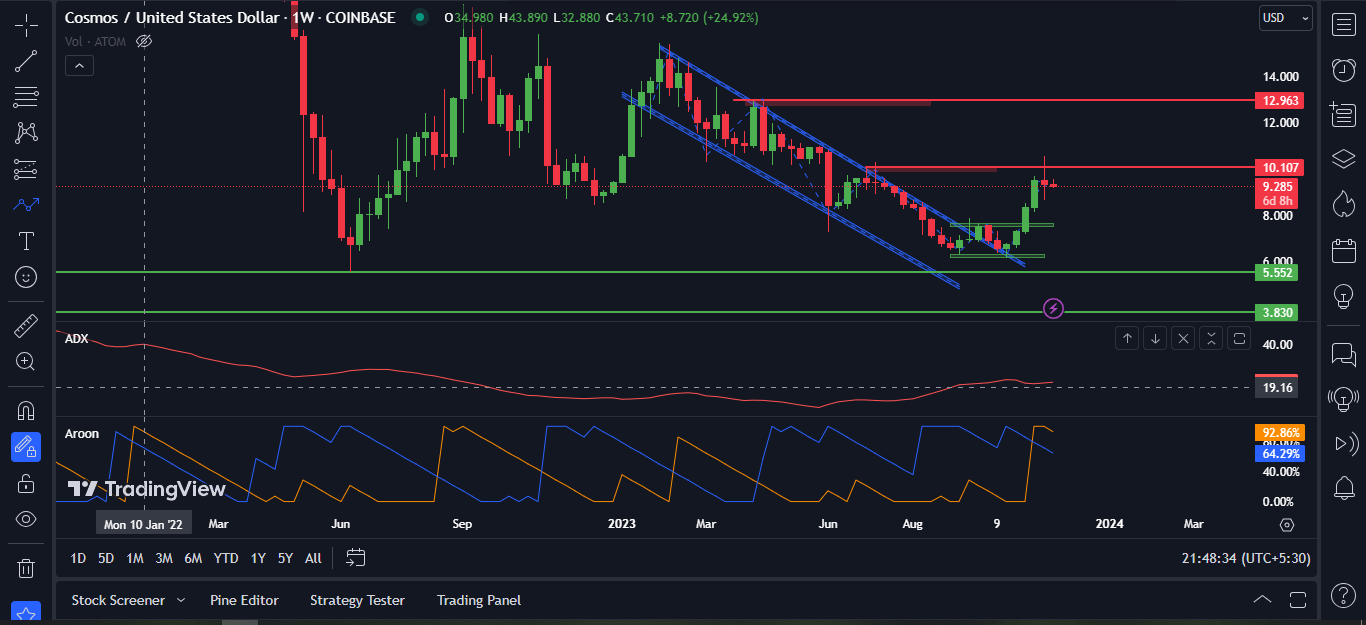
The RSI curve floating near 55 showed a rise from the neutral zone, indicating buyers’ presence in the previous trading sessions.The MACD indicator shows a bullish momentum and maintains green bars on the histogram, suggesting the bullishness of the crypto.
Summary
The ATOM coin’s technical oscillators support the bullish trend. The MACD, RSI, and EMAs are emphasizing negative signs and implying that the downtrend may continue in the Cosmos crypto price.
The ATOM Price action suggests that the investors and traders are bullish on the 1-D time frame. The price action reflects a bullish perspective at the moment. Moreover, ATOM Investors avoid the fear of missing out. Scarcity is created in the crypto market to gain more investors and creditors. It is better to keep it at arm’s length as this may result in one of the emerging reasons for market volatility.
Technical Levels
Support Levels: $8.617 and $8.141
Resistance levels: $10.180 and $11.000
Disclaimer
This article is for informational purposes only and does not provide any financial, investment, or other advice. The author or any people mentioned in this article are not responsible for any financial loss that may occur from investing in or trading. Please do your own research before making any financial decisions.

Amanda Shinoy is one of the few women in the space invested knee-deep in crypto. An advocate for increasing the presence of women in crypto, she is known for her accurate technical analysis and price prediction of cryptocurrencies. Readers are often waiting for her opinion about the next rally. She is a finance expert with an MBA in finance. Quitting a corporate job at a leading financial institution, she now engages herself full-time into financial education for the general public.


