
 Home
Home News
News
- 1 APT token price showed a rising wedge breakout above $6.50.
- 2 Buyers have gained traction and are looking to surpass $8.00.
Aptos (APT) APT price delivered a trend reversal and is heading towards the swing of $8.00. Moreover, the price action indicates a bullish action after a long time, and investors are trying to regain the shine. Furthermore, the chart shows the rising wedge breakout, the APT token has surpassed the significant moving averages, and the long buildup activity in the recent sessions. However, the buyers have failed to reach the barrier of $8.00 and showed rejection in the last trading sessions.
APT token corrected and flipped from the support zone of $4.90. The token surged over 40% this month,highlighting buying interest. Aptos Labs launched Identity Connect Service, which reacted positively and gained pace. Afterwards, buyers continued to put in efforts and broke out above the barrier of $7.00.
The live price of the APT token is $7.036, with an intraday gain of 1.60%, showing neutrality on the charts. Moreover, the trading volume increased by 9.35% to $336.50 Million, and the pair of APT/BTC is at 0.0000522 BTC. However, the market cap of APT is $1.18 Billion. Analysts have maintained a neutral rating and suggest a growth outlook for the upcoming sessions.
Will APT Reach $10 by End of 2023?
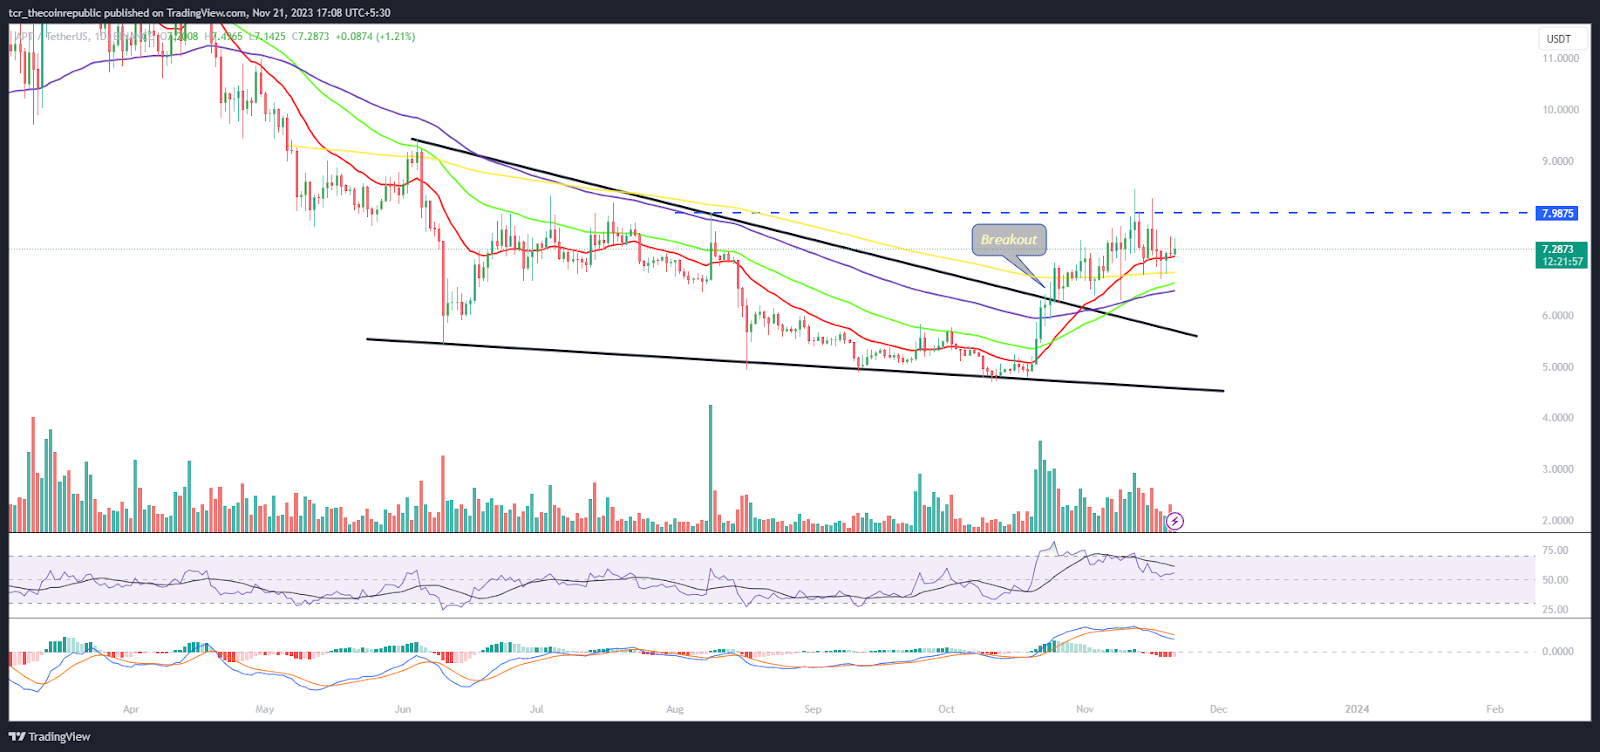
On the daily chart, the APT token showcased a reversal and is forming higher highs, witnessing buying interest. Furthermore, the token has approached neutrality as the selling pressure abated. Additionally, the token bounced from the neckline post breakout and is ready to escape the swing high of $8.00. If it surpasses the $8 mark, buying momentum will rise, and the token may reach $10 soon.
The RSI curve stayed in the overbought zone and formed a negative crossover, indicating a volatile chart setup.
The MACD indicator shows a bearish crossover and red bars on the histogram, suggesting that APT has the potential to outperform soon.
Weekly Charts Suggest End of Selloff
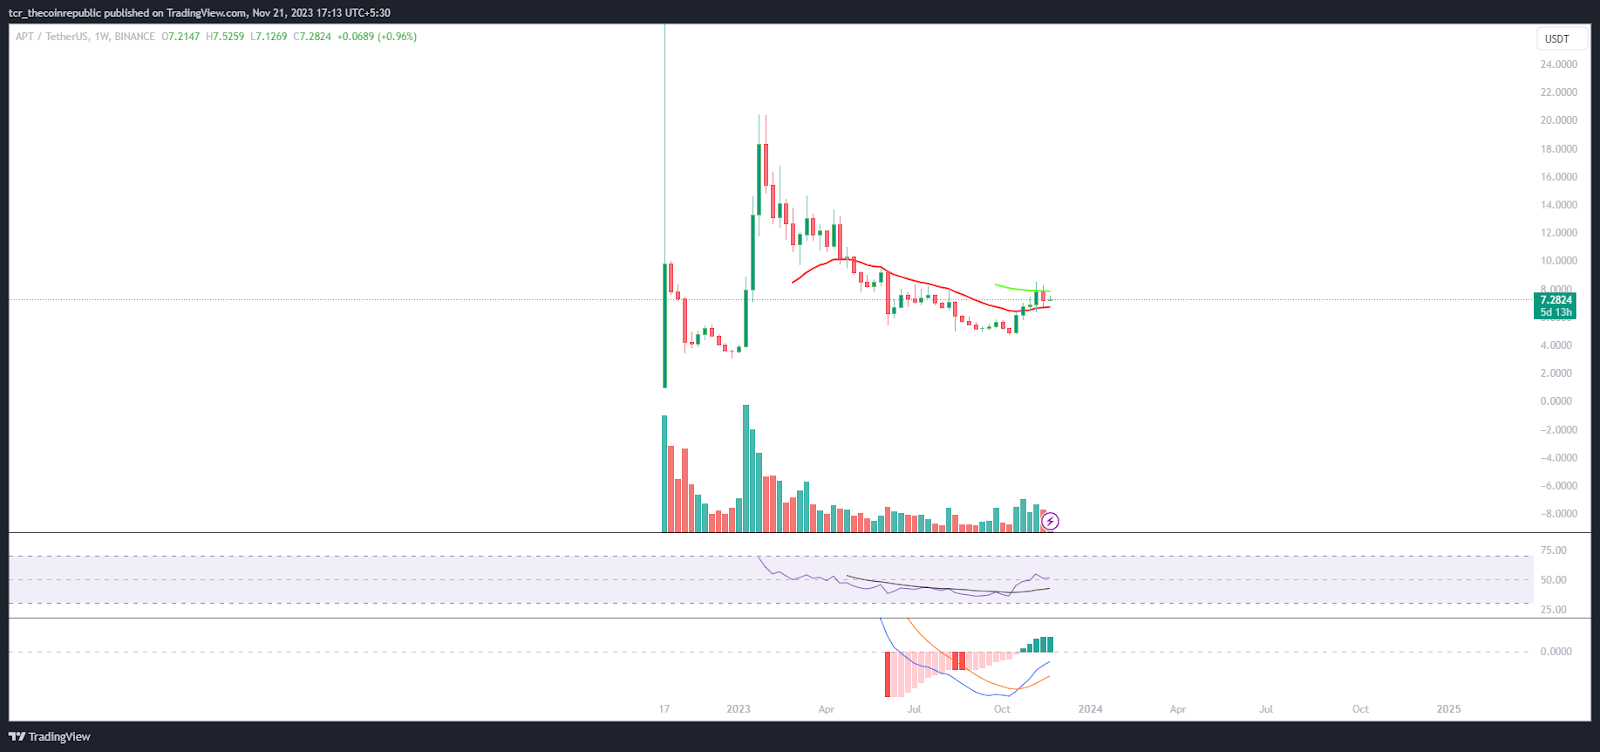
On the weekly chart, the APT token has noted a downtrend and is in a bearish trajectory. Additionally, the token hovered near the 20-day EMA and healed back from the support zone of $5.00. Amid the retracement from the highs of $20, the token has almost corrected over 70% and witnessed seller dominance.
Summary
Aptos token price is at a make-or-break level close to the resistance mark of $8.00, where buyers continue to face rejection. However, the buyers did not lose their momentum and are holding the gains above the 200-day EMA, highlighting buying momentum.
Technical Levels
Support Levels: $7.00 and $6.60
Resistance Levels: $8.00 and $8.50
Disclaimer
The views and opinions stated by the author or any other person named in this article are for informational purposes only and do not constitute financial, investment, or other advice. Investing in or trading crypto or stocks comes with a risk of financial loss.

Adarsh Singh is a true connoisseur of Defi and Blockchain technologies, who left his job at a “Big 4” multinational finance firm to pursue crypto and NFT trading full-time. He has a strong background in finance, with MBA from a prestigious B-school. He delves deep into these innovative fields, unraveling their intricacies. Uncovering hidden gems, be it coins, tokens or NFTs, is his expertise. NFTs drive deep interest for him, and his creative analysis of NFTs opens up engaging narratives. He strives to bring decentralized digital assets accessible to the masses.


