
 Home
Home News
News

- 1 Uniswap coin witnessed a channel breakout on the chart.
- 2 UNI price is now ready to catch the swing zone of $7.00.
Uniswap (UNI) coin has attained momentum and showed a falling channel breakout above the barrier of $4.40. Moreover, the UNI coin surpassed the key moving averages and is heading to retest the supply zone of $7.00, which is a make-or-break zone. Additionally, the coin did its correction and flipped from the low of $3.50. As the crypto market started pumping, the gains and investors showed their buying interest, and UNI coin recovered the gains of over 40% and healed the muscles.
Uniswap (UNI) price surpassed the crucial resistance zone of $5.00 and has trapped the sellers. Moreover, the price action has witnessed the buying interest, and bullish momentum was seen on the charts. Additionally, the coin has surpassed the key moving averages, pausing and forming higher highs. Recently, Uniswap launched the Android Mobile Wallet app with a built-in swap facility on Google Play Store. This coin reacted positively to the news, as sellers started covering their positions.

The live price of the Uniswap coin is $5.09, with an intraday drop of 1.70%, showing neutrality on the charts. Moreover, the trading volume increased by 2.78% to $95.74 Million, and the pair of UNI/BTC is at 0.000137 BTC. However, the market cap of UNI is $4.40 Billion. Analysts have maintained neutrality and are suggesting a favorable bullish outlook for the upcoming sessions.
Will Uniswap (UNI) Retest $7.00?
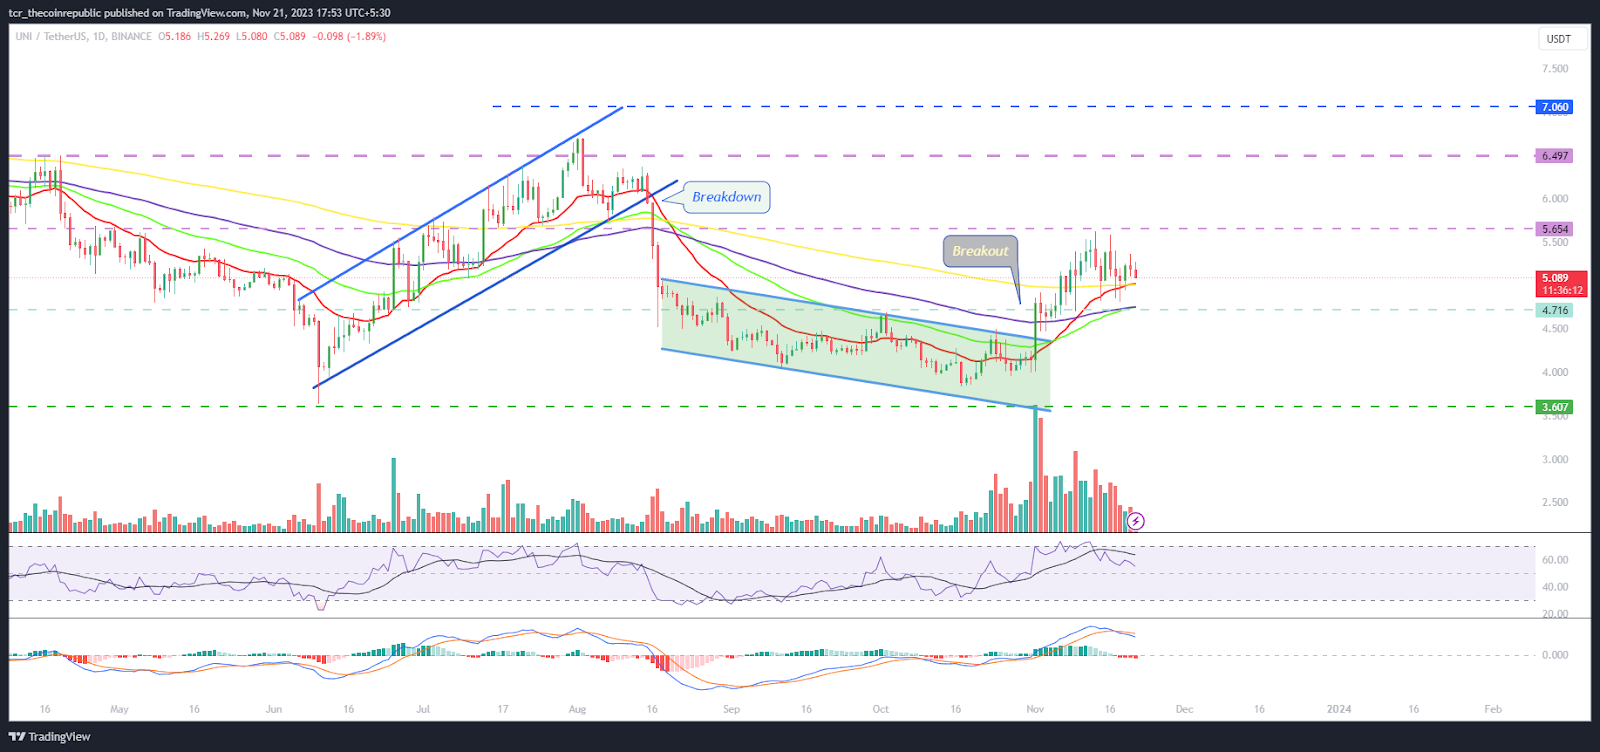
On the daily chart, Uniswap (UNI) price shows a trend reversal and registered a falling channel breakout. Additionally, the coin has approached the neutral trajectory, absorbed the bearish headwinds, and is gaining momentum now. The coin has surpassed the 38.2% Fibonacci retracement level and looks strong per the technical chart setup.
The RSI curve stayed in the overbought zone near 70 and showed a bullish divergence, suggesting a bullish grip in the past trading sessions.The MACD indicator shows a bearish crossover and formed red bars on the histogram, highlighting profit booking on the charts.
Weekly Charts Shows Triple Bottom Pattern
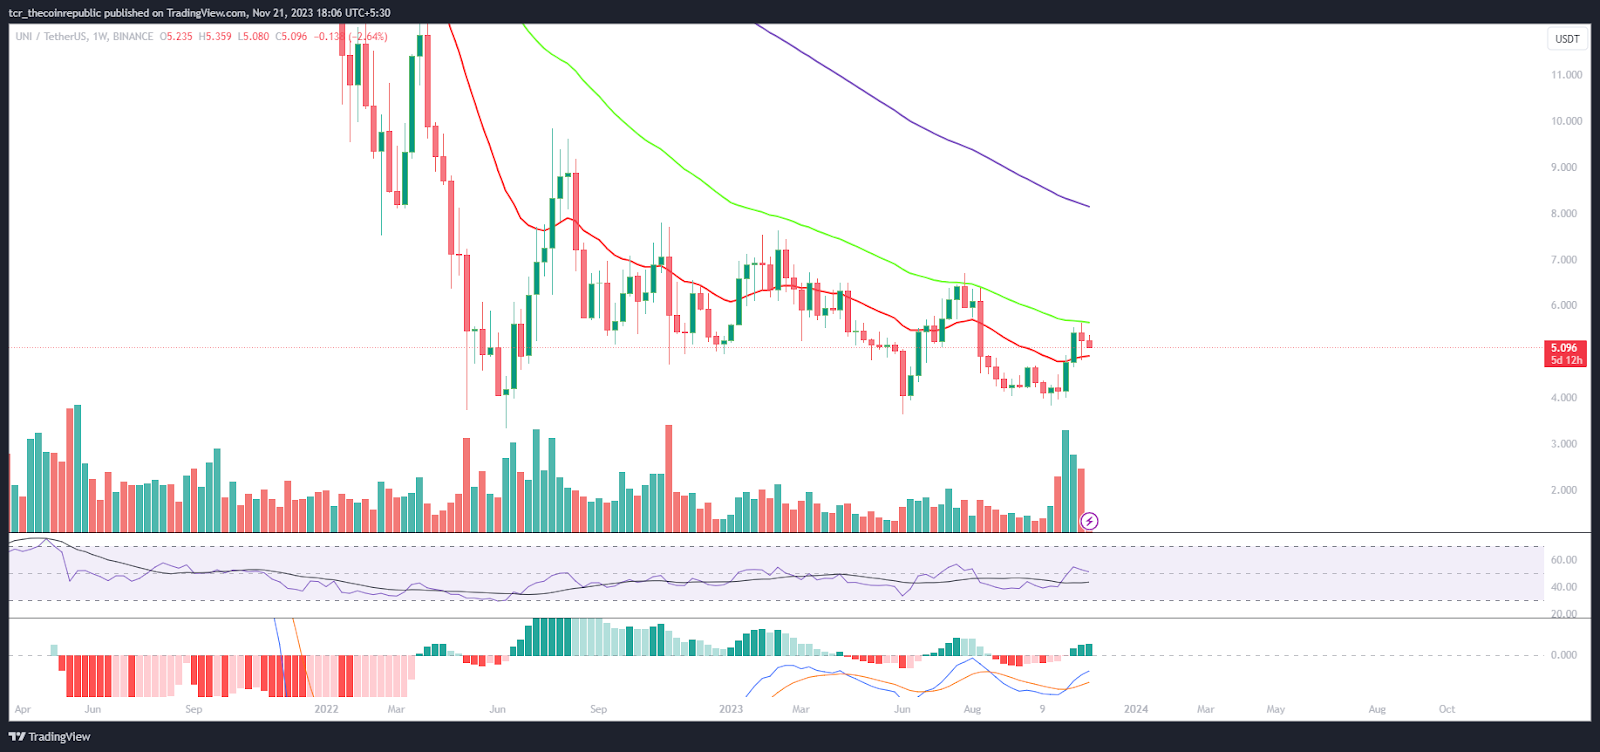
On the weekly chart, the UNI coin formed a triple bottom pattern near $4.00, close to the 50-day EMA hurdle. Furthermore, the UNI coin is trading close to the upper trendline and may soon register the breakout above $6.00 and will reach the 100-day EMA mark near $8.00.
Summary
Uniswap (UNI) price has surpassed the 200-day EMA and produced a parabolic recovery. Moreover, the UNI coin is close to the foremost hurdle of $6.00, which, if surpassed, UNI will hit the swing highs of $7.00 soon and may reach the trajectory highs of $10 by 2024.
Technical Levels
Support Levels: $5.00 and $4.80
Resistance Levels: $5.70 and $6.50
Disclaimer
The views and opinions stated by the author or any other person named in this article are for informational purposes only and do not constitute financial, investment, or other advice. Investing in or trading crypto or stocks comes with a risk of financial loss.

With a background in journalism, Ritika Sharma has worked with many reputed media firms focusing on general news such as politics and crime. She joined The Coin Republic as a reporter for crypto, and found a great passion for cryptocurrency, Web3, NFTs and other digital assets. She spends a lot of time researching and delving deeper into these concepts around the clock, and is a strong advocate for women in STEM.


