
 Home
Home News
News
- 1 QNT crypto surged by 1.88% in market value and by 12.84% in trading volume in the last 24 hours.
- 2 Quant (QNT) open interest is $7.98 Million; it rose by 12.01% in the previous session.
QNT is the Quant network’s native cryptocurrency. It functions as a main medium of exchange on the platform. It allows holders to have a say and take part in the network’s governance and it can be used to pay the fees and to protect the network through the strong proof-of-stake (PoS) and the proof-of-activity (PoA) consensus mechanisms.
Quant (QNT) has a maximum market cap of $1,466,692,288, which is the fully diluted valuation (FDV) of the cryptocurrency. As per data on Coingecko, it is based on the assumption that all 15 Million QNT tokens are circulating in the market today. However, the actual number of QNT tokens in circulation may be lower, depending on how the QNT tokens are released over time. Therefore, it may take several years before the FDV is achieved.
QNT crypto surged by 1.88% in market value and by 12.84% in trading volume in the last 24 hours, per Coinmarketcap. At press time, its market value is $1,215,464,461 and its trading volume is $17,635,985. There are 12,072,738 QNT in circulation.
Quant (QNT) open interest is $7.98 Million, as per Coinglass, which is a crypto analysis website, it rose by 12.01% in the previous session. The long versus short ratio for 24 hours is 0.9139. The total number of short positions added in the last 24 hours is zero against longs of $365.483.
Moreover, QNT has shown good performance this month, as it rose by 16.45% but fell by 1.85% in the past six months. Also, the year-to-date return of QNT price is negative with a 4.30% decline.
Price Movement of Quant in Daily Time Frame
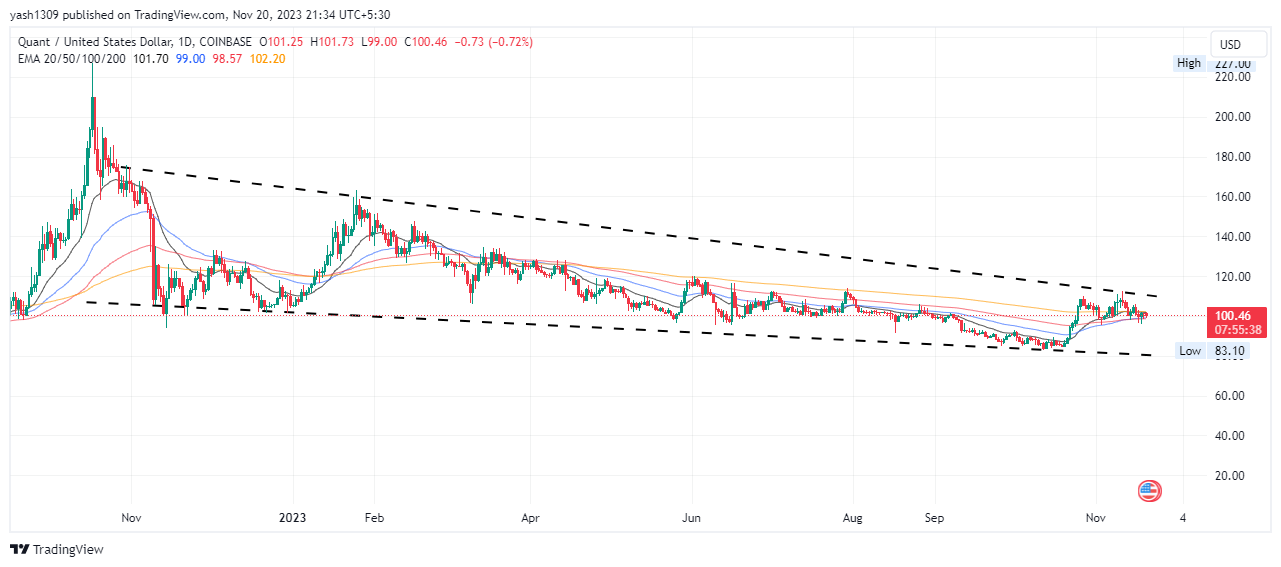
The Quant is showing a downtrend, and formed a channel between the support and resistance lines. The price tried to bounce back several times, but could not break the resistance level. The price was squeezed in a tightened range.
The QNT price is struggling to stay near the trendline resistance, which is a key obstacle for QNT. The QNT price needs a spikes in buying pressure to overcome this hurdle, or else, the QNT prices will continue to decline.
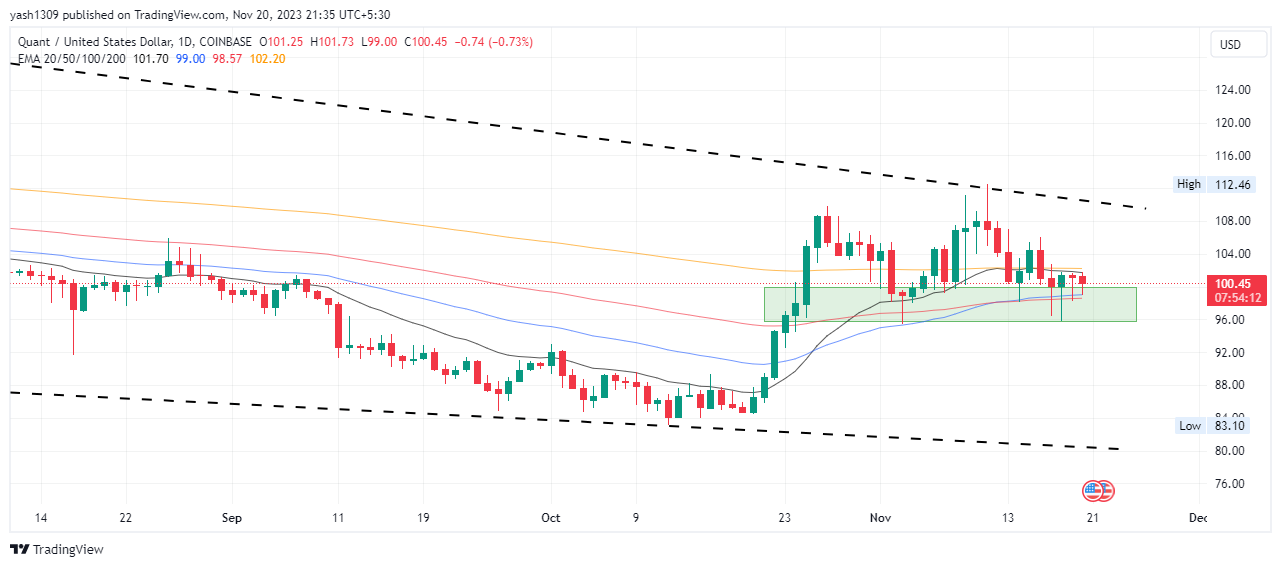
On analyzing the chart on a daily time frame, the price of the QNT/USD pair fell by 4.11% since the start of the year, which displays bearish dominance. The QNT price is trading under a tightened range, and it needs a boost in price momentum to break out of it.
The QNT/USD could start a huge rally if it breaks the $110 level, which is near the resistance trendline. It could mark new highs in the upcoming sessions. Buyers look geared up to overcome the hurdles and skyrocket to new price levels from its current price. On the contrary, if QNT/USD falls, then it could decline to $85.
QNT/USD is currently trading between the major exponential moving averages. If more buyers enter the market, QNT price pairs could increase more by creating higher highs and new highs. Therefore, the QNT price is likely to move upwards and show a bullish outlook on the daily chart.
30-Day MVRV Shows its Price Might Trigger and Rise
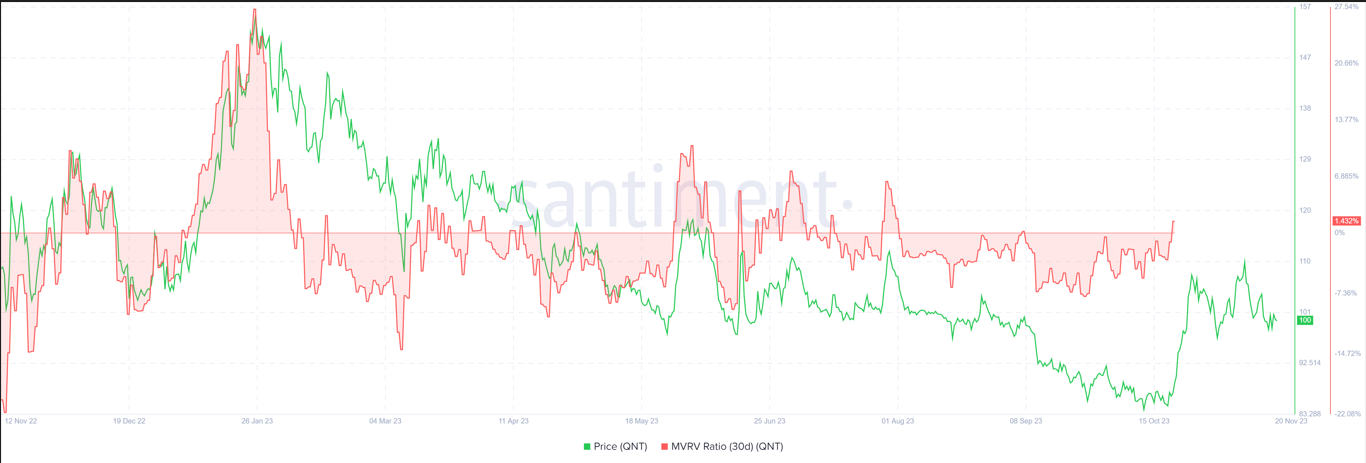
This graph shows the relationship between the Quant cryptocurrency price and the MVRV rate over the last 30 days. Basically, it is used to estimate the average profit or loss of investors who purchased an asset over the past 30 days.
As it can be seen from the chart, the price of Quant and the MVRV ratio are synced and positively correlated with each other and tend to move in the same direction.
As the price rises, the MVRV ratio also rises, indicating that more investors can make money and cash it out. Likewise, as prices fall, the ratios follow suit, meaning more investors are likely to lose money.
This chart highlights a consolidation phase, as the graph has not been displaying any significant movement for a while.
Summary
The Santiment indicator chart of the Quant shows between its crypto price and the 30-day MVRV ratio, that it could have a positive correlation, which indicates that they tend to move in the same direction.
Furthermore, in the daily time frame, it seems like Quant is trying to sustain and getting geared up to trigger an amazing rally out from the channel with the assistance of buyers. This could signal that the bulls might get control of Quant and could push its price above the resistance level and higher from the current level.
Technical Levels
Support Levels: $85
Resistance Levels: $110
Disclaimer
In this article, the views, and opinions stated by the author, or any people named are for informational purposes only, and they don’t establish investment, financial, or any other advice. Trading or investing in cryptocurrency assets comes with a risk of financial loss.

Amanda Shinoy is one of the few women in the space invested knee-deep in crypto. An advocate for increasing the presence of women in crypto, she is known for her accurate technical analysis and price prediction of cryptocurrencies. Readers are often waiting for her opinion about the next rally. She is a finance expert with an MBA in finance. Quitting a corporate job at a leading financial institution, she now engages herself full-time into financial education for the general public.


