
 Home
Home News
News
- 1 QNT token is hovering close to the round mark of $100.
- 2 Quant witnessed profit booking in the last trading sessions.
Quant (QNT token) price is close to the round mark of $100; falling wedge breakout was witnessed. Afterwards, QNT crypto attained momentum and rose to the neckline of $110, where buyers faced rejection and retraced to the support zone of $95. Amid the sacrifice, the QNT token claimed the breakout and is ready to outperform the crypto market. Following the flight with the crypto pump, the QNT token signifies a potential to retest the swing of $120 soon.
QNT token recovered from the support zone of $85 and noted a sharp up move led breakout of the falling wedge pattern. Recently, the token faced a barrier near $110, and profit booking was pointed out in the past trading sessions, resulting in slippage below the 20-day EMA mark. Technicals highlight the bulls’ comeback, suggesting that QNT may surpass the immediate hurdle of $110 and will skyrocket soon.
The live price of the QNT token is $98.6, with an intraday drop of 0.69%, showing neutrality. Moreover, the trading volume increased by 1.88% to $33.67 Million, and the pair of QNT/BTC is at 0.00270 BTC. The market cap of QNT is $964.82 Million. Analysts have maintained a neutral rating and suggest that the price could rise above $100 in the upcoming sessions.
Will Quant Token SkyRocket Gains Above $100?
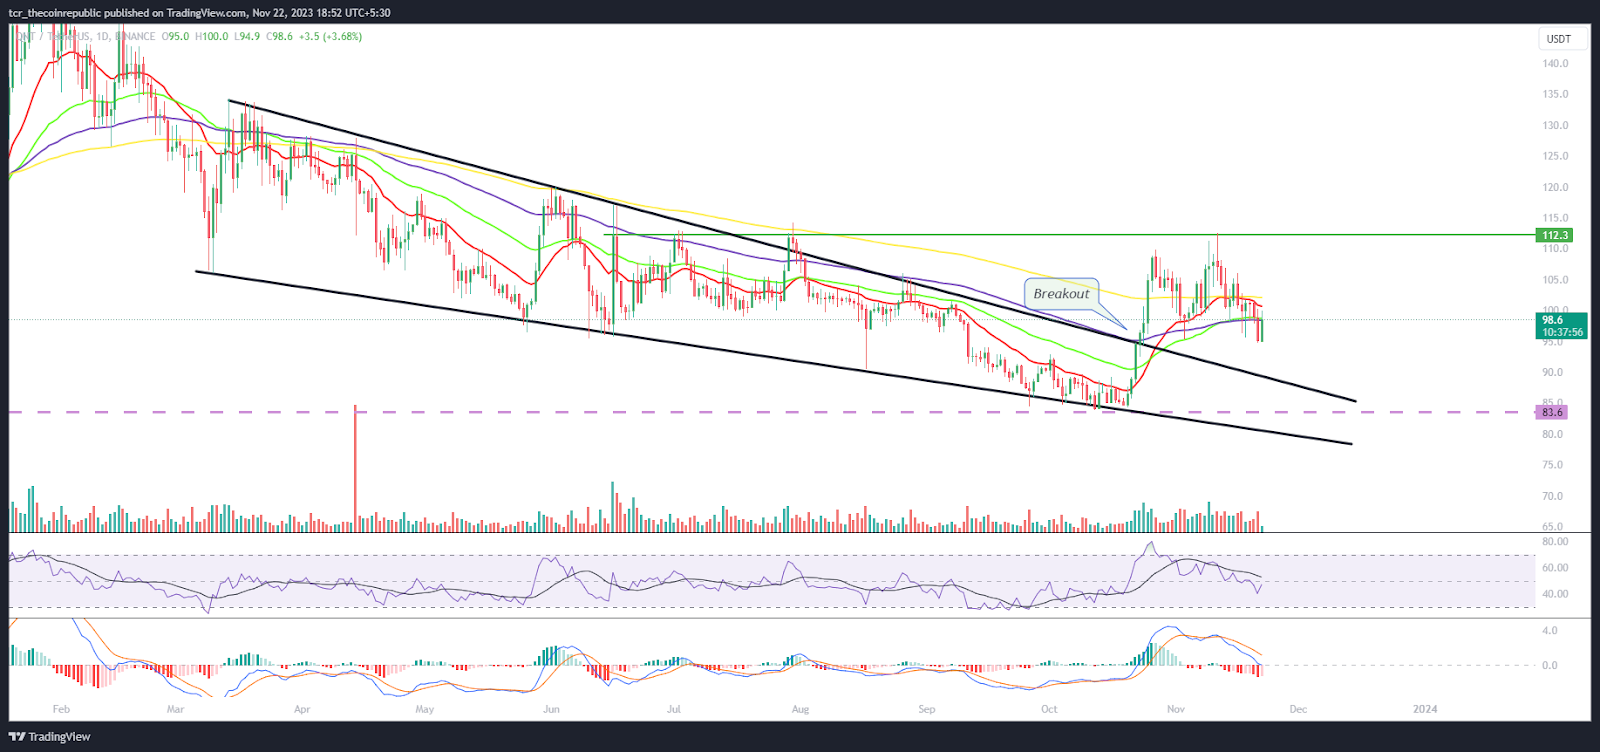
On the daily chart, the QNT token price is trading between the support zone of $95 and the immediate hurdle of $100 and is in a dilemma. Moreover, the price action shows that sellers are trying to break the buyers’ momentum and trying to retest the trendline mark of $90. The token has faced the 50% Fibonacci retracement zone and is reversed to the 38.2% zone.
The RSI curve stayed in the overbought zone, noted a negative crossover, and is headed toward neutrality.The MACD indicator showed a bearish crossover and formed red bars on the histogram, witnessing profit booking in the last sessions.
Weekly Charts Signifies Rejection From 100 Day EMA?
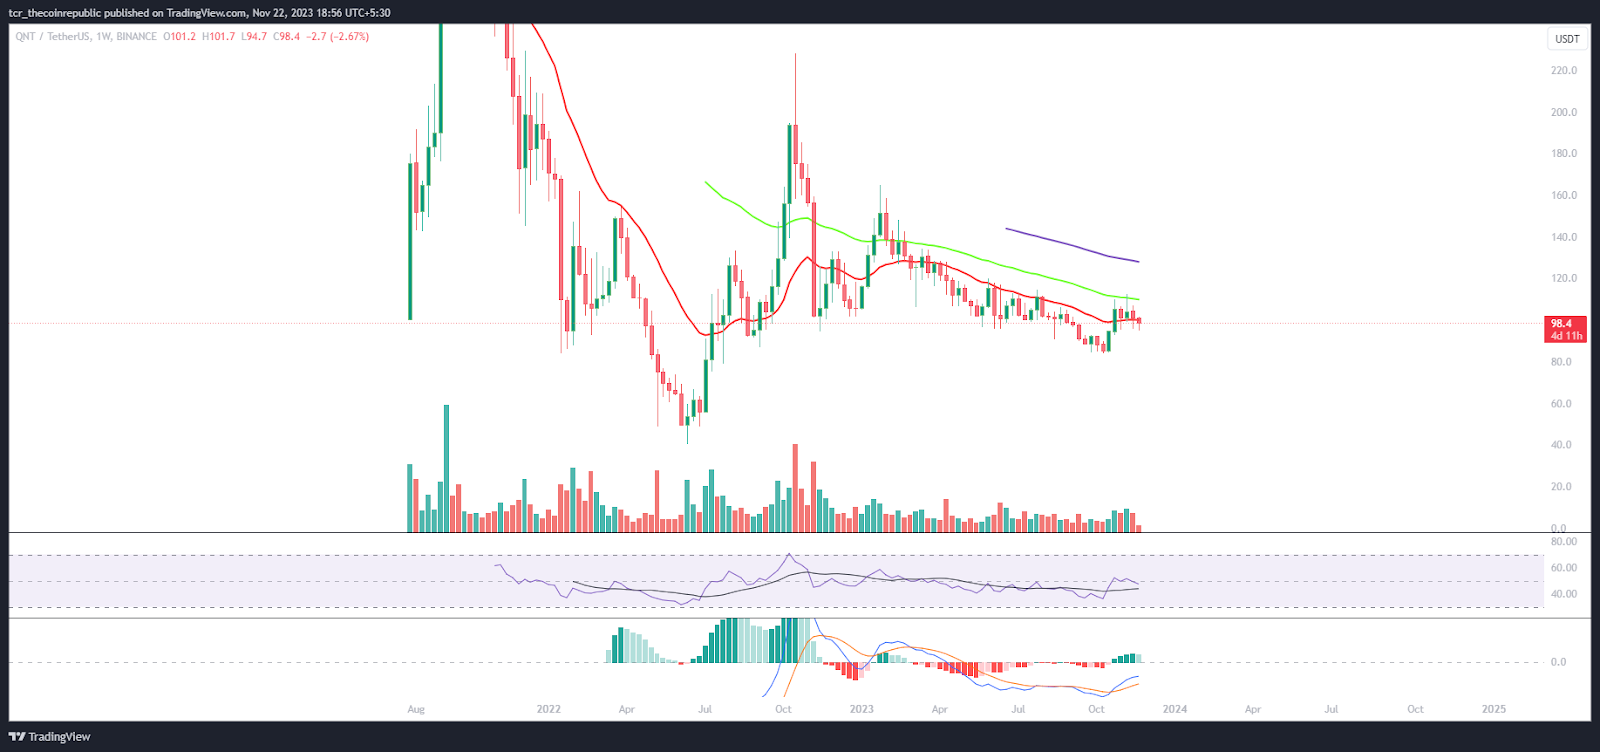
On the weekly charts, QNT token price has faced an upper trendline barrier near the 100-day EMA mark and is pausing the gains close to $100. The battle is fascinating, where the incisiveness between the bulls and bears is noted. However, the token has done the correction and can potentially retest the swing highs of $125 by the end of 2023.
Summary
Quant token (QNT) price initiated a recovery from the support zone of $80 and is heading to scratch the round mark of $100. Meanwhile, sellers looked strong and protected the region decisively, resulting in a throwback below the 20-day EMA mark.
Technical Levels
Support Levels: $90 and $85
Resistance Levels: $100 and $110
Disclaimer
The views and opinions stated by the author or any other person named in this article are for informational purposes only and do not constitute financial, investment, or other advice. Investing in or trading crypto or stocks comes with a risk of financial loss.

Andrew is a blockchain developer who developed his interest in cryptocurrencies while pursuing his post-graduation major in blockchain development. He is a keen observer of details and shares his passion for writing, along with coding. His backend knowledge about blockchain helps him give a unique perspective to his writing skills, and a reliable craft at explaining the concepts such as blockchain programming, languages and token minting. He also frequently shares technical details and performance indicators of ICOs and IDOs.


