
 Home
Home News
News

- 1 TRX coin price has been on an uptrend for the past few sessions.
- 2 TRON is on the rising groove and persists in unfolding the gains.
TRON (TRX) coin glimpsed buying momentum and persisted in forming higher highs, conveying the charts’ uptrend. Moreover, the TRX coin price has approached the $0.10100 mark above the neutral trajectory. Recently, the TRX coin retraced to the 50-day EMA mark post-rejection from $0.11000. Technicals show that the TRX coin was bullish.

TRX coin price rose above the key moving averages and triggered a bullish engulfing candlestick in yesterday’s trading session, signifying the outperformance on the charts. Furthermore, the buyers have persisted in accumulating the coin and are keen to escape the resistance mark of $0.11000. TRX coin has made a strong bottom near $0.07200 and continued to show bullishness.

The live price of the TRX coin is $0.1014, with an intraday gain of 3.78%, showing bullishness on the chart Moreover, the trading volume increased by 3.90% to $559.50 Million, and the pair of TRX/BTC is at 0.00000272 BTC. The market cap of TRX is $9.11 Billion. Analysts have maintained an outperform rating and have suggested growth estimates for the following sessions.
Will TRON (TRX) Reach $0.12000 by the end of 2023?
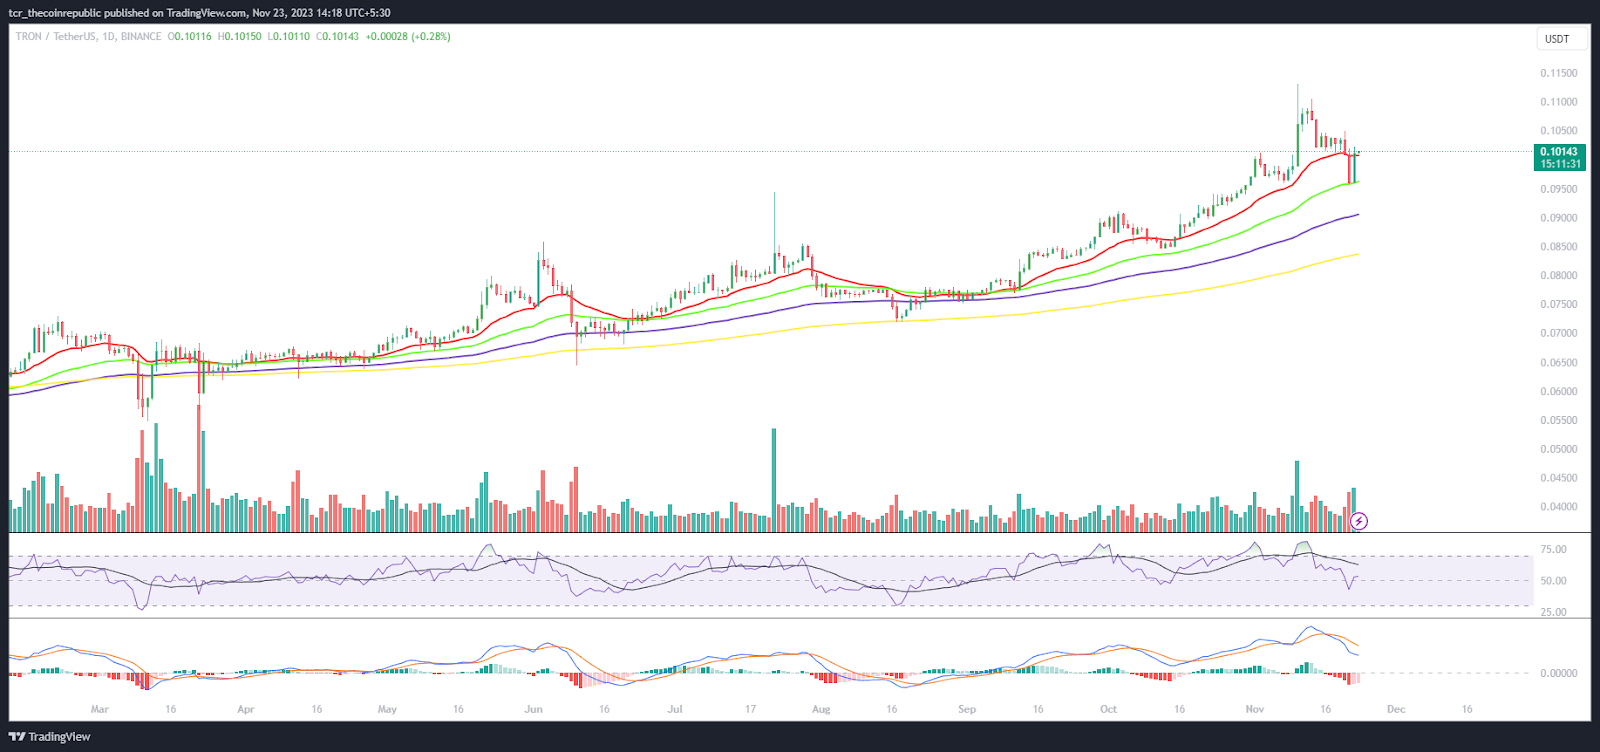
On the daily chart, the TRX coin price is changing on a bullish track and survives, extending the gains, as buyers continue to dominate and preserve the gains. Furthermore, the price action shows that the TRX coin is trading above the 50% Fibonacci retracement zone and is close to the 61.8% zone. However, the coin failed to overtake the upper Bollinger band and is near the trajectory upper swing hurdle of $0.10160.
The RSI curve stayed near neutrality and formed a negative crossover, indicating a retracement on the charts. The MACD indicator shows a bearish crossover and formed red bars on the histogram highlighting the volatility.
Weekly Charts Exhibits Buyers Domination
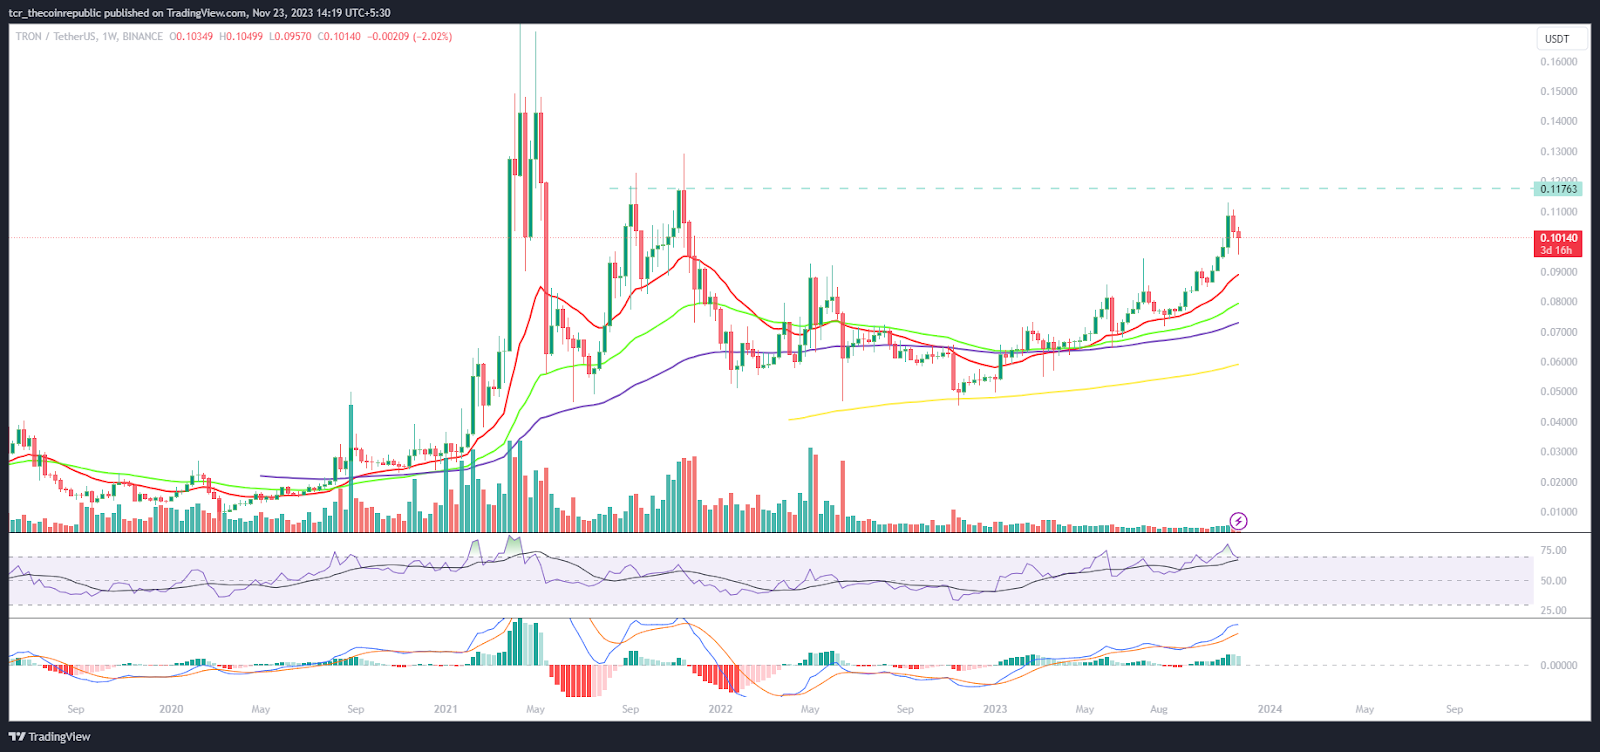
On the weekly chart, the TRX coin reveals a parabolic-shaped recovery and is close to the prompt neckline of $0.12000, the supply zone, and bulls are targeting it. Moreover, the price action gives a strong conviction that the TRX coin will continue to rise and may reach the swing high of $0.12500 soon.
Summary
Tron (TRX) coin price is staying above neutrality. Following the crypto market pump, the TRX coin is the investors’ top pick. Technicals suggest that buyers will continue to dominate.
Technical Levels
Support Levels: $0.9490 and $0.9000
Resistance Levels: $0.11300 and $0.11800
Disclaimer
The views and opinions stated by the author or any other person named in this article are for informational purposes only and do not constitute financial, investment, or other advice. Investing in or trading crypto or stocks comes with a risk of financial loss.

Amanda Shinoy is one of the few women in the space invested knee-deep in crypto. An advocate for increasing the presence of women in crypto, she is known for her accurate technical analysis and price prediction of cryptocurrencies. Readers are often waiting for her opinion about the next rally. She is a finance expert with an MBA in finance. Quitting a corporate job at a leading financial institution, she now engages herself full-time into financial education for the general public.


