
 Home
Home News
News
- 1 TIA token price lost momentum and is hovering near the $5.50 mark.
- 2 Buyers are trying to regain shine and attempt a rebound.
Celestia (TIA) token price is poised near $5.00 and is losing momentum after the recent rally. The token is now forming lower lows, surviving near the 100-day EMA, where bulls failed to surpass the 20-day EMA. Moreover, the TIA token is hovering near the support zone and trying to settle the gains. The price action signifies the profit booking, and sellers continue pushing the token and looking to throw below $5.00 to extend the weakness.
Meanwhile, the TIA token established a bullish engulfing candlestick during the fall near $5.00 and showed a pullback. Currently, the TIA token claims the grip near the 38.2% Fibonacci retracement zone and is trying to surpass the 50-day EMA to initiate a rebound. However, the battle is favoring the sellers who continued to showcase their giant muscles.
The live price of the Celestia token is $5.57, with an intraday drop of 6.07%, highlighting neutrality. Moreover, the trading volume increased by 15.33% to $123.02 Million, and the market cap fell to $786.15 Million. Analysts have maintained a neutral rating and suggest further volatility will continue in the upcoming sessions.
Will TIA Token Hold the $5.00 Mark?
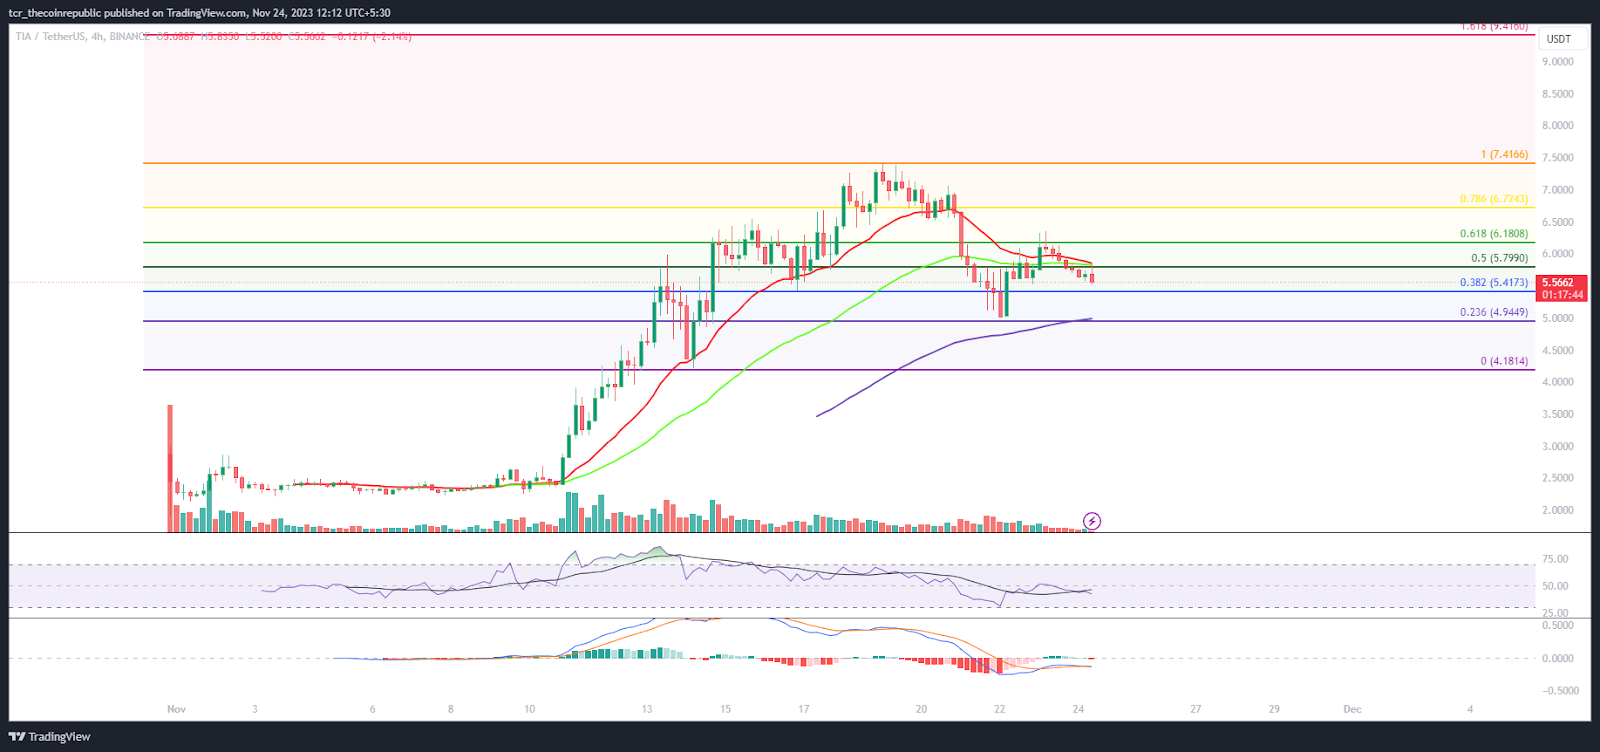
On the 4-hour chart, the TIA token price is near the 50-day EMA mark and is trying to hold the gains. Moreover, the technicals show that the TIA token was in a strong uptrend during the start of 2023 and reached a high of $7.50. During that period, TIA has hit a total market cap close to $1 Trillion.
The RSI curve stayed near the midline of 50, showing a negative divergence, suggesting that the TIA token may soon retest the round mark of $5.00. The MACD indicator shows a bearish crossover and red bars on the histogram, suggesting a negative outlook for the upcoming sessions.
Celestia (TIA) on Hourly Charts Signifies Breakdown
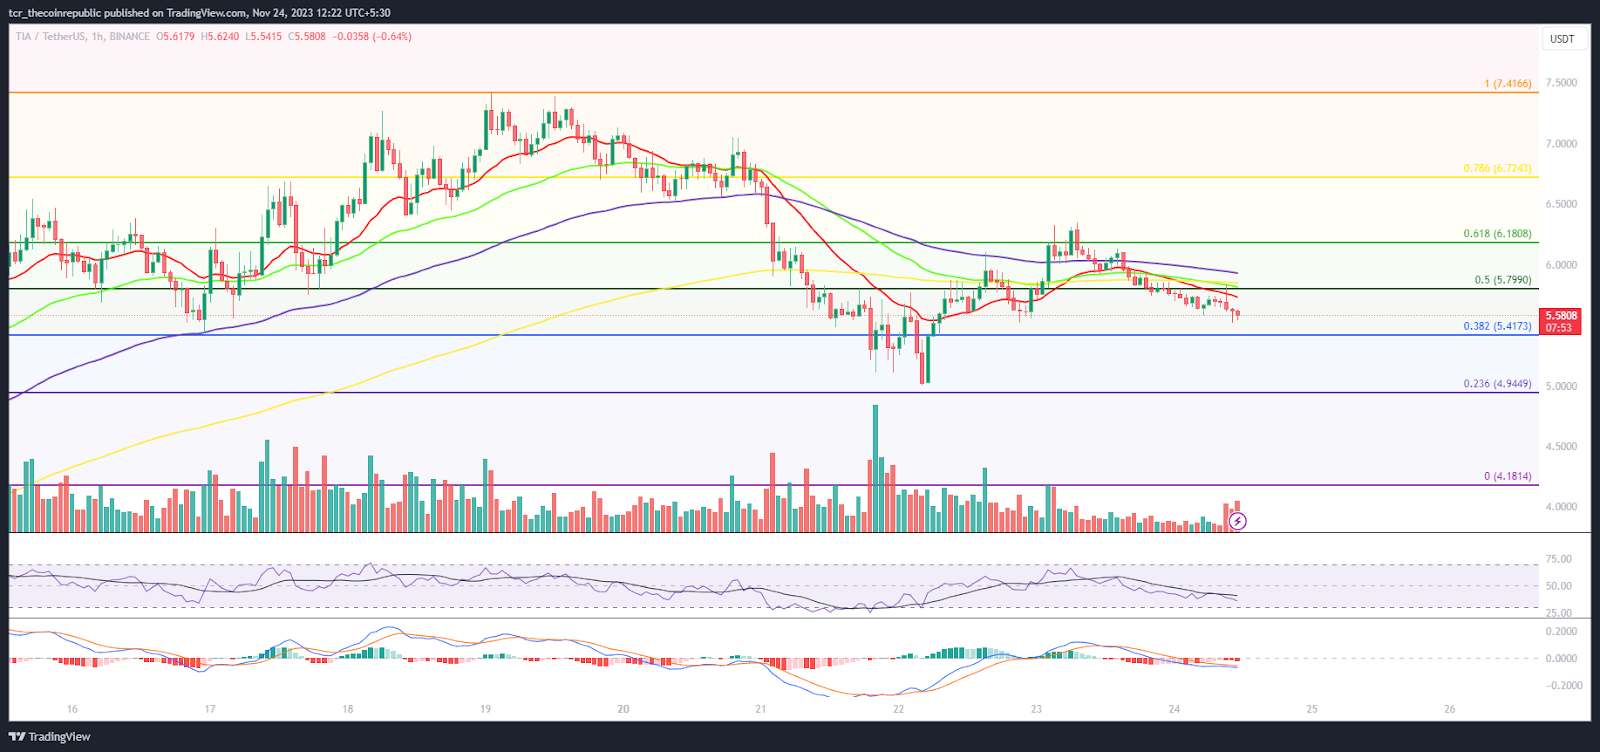
The TIA token has slipped below the key moving averages on the hourly chart and highlights volatility. Moreover, the price action indicates the rounding top formation and suggests that the token may slip toward $5.00 soon. Furthermore, the technical indicators show an oversold status, and further downside may be anticipated in the following sessions.
Summary
Celestia (TIA) token price faces a retracement phase, and the price slips from the higher zone of $7.50 and is heading to retest the round mark of $5.00. Moreover, the price action highlights the seller dominance. The token slipped below the 50-day EMA mark and is heading to the 100-day EMA mark.
Technical Levels
Support Levels: $5.20 and $5.00
Resistance Levels: $5.80 and $6.00
Disclaimer
The views and opinions stated by the author or any other person named in this article are for informational purposes only and do not constitute financial, investment, or other advice. Investing in or trading crypto or stocks comes with a risk of financial loss.

Steefan George is a crypto and blockchain enthusiast, with a remarkable grasp on market and technology. Having a graduate degree in computer science and an MBA in BFSI, he is an excellent technology writer at The Coin Republic. He is passionate about getting a billion of the human population onto Web3. His principle is to write like “explaining to a 6-year old”, so that a layman can learn the potential of, and get benefitted from this revolutionary technology.


