
 Home
Home News
News
- 1 GAS price surged 14% in the previous trading session.
- 2 The sudden rise in the trading volume shows speculators are active.
- 3 GAS crypto price is highly volatile.
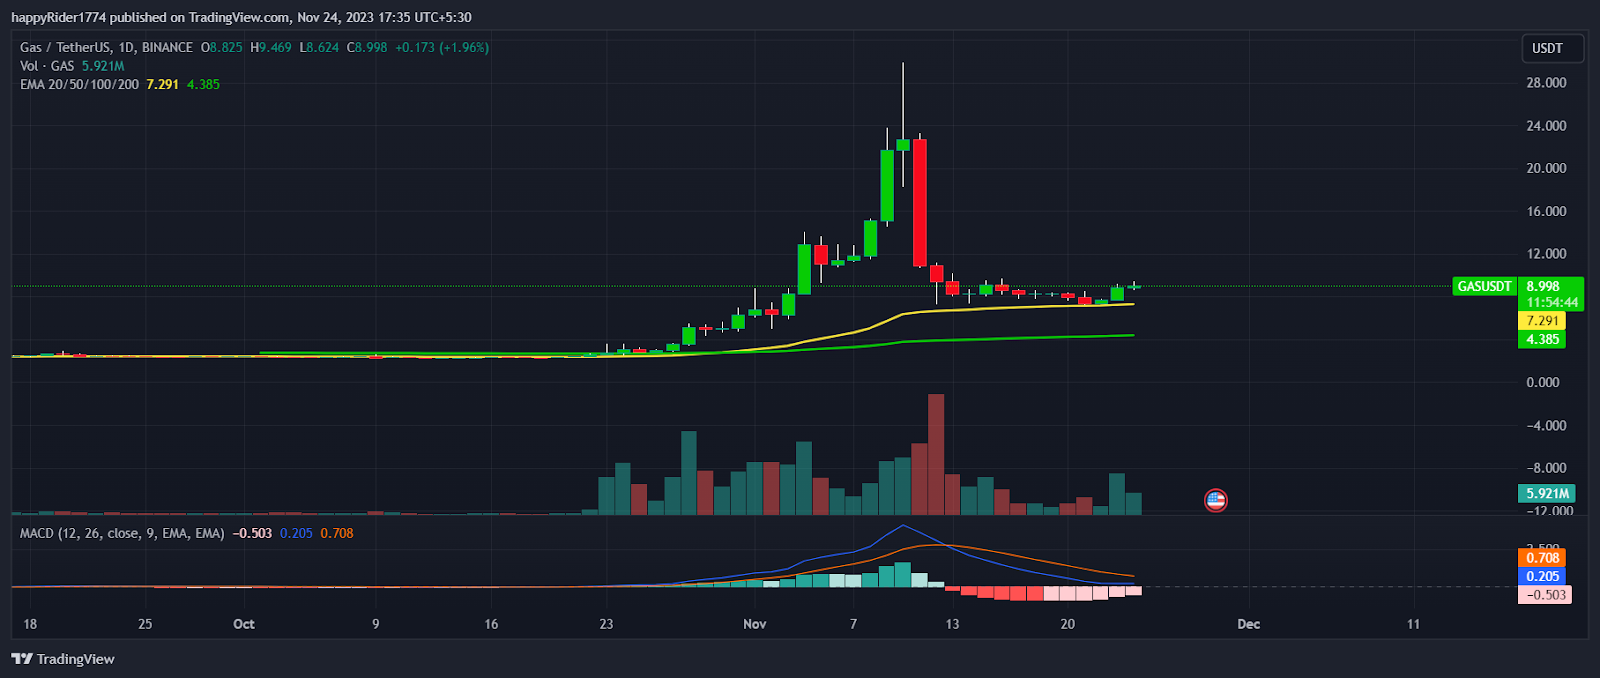
GAS price surged 14% in the previous trading session and showed a decent bounce from the 50-day EMA.
In November, GAS crypto price suddenly rose and began to recover by forming higher high candles. Meanwhile, the trading volume also increased which added fuel to the rally.

The price rallied more than 700% in a short period of time and hit a swing high at $29.906. However, the buyers failed to hold the higher levels and the price faced sharp rejection. It shows that the up move is speculative and lacks genuine buying.
Later, the GAS token price reversed down and fell 51% in a single day. It eroded 50% of the gains and slipped below the $10.00 level.
The downfall halted near $7.00 and the price entered a consolidation. At present, the price is spending time in a range between $7.00 to $10.00.
The next direction in GAS crypto price will be visible when buyers or sellers break out from either side of the range. Currently, GAS price is trading at $8.998 with a one-day increase of 1.96%.
GAS Price Analysis: Is it a Pump and Dump Crypto?
GAS price is highly volatile and speculators are active so it will be difficult to break the $10.00 hurdle.
The price action shows that the Gas token price got pumped in the first half of November and then it dumped in the second half. Therefore, it will be highly risky to build any positions.
Till the Gas token price is trading below $16.00, the sellers will remain active and will try to build shorts on every rise. On the other hand, if the Gas token price drops below $7.00, then bears may try to pull it down toward the previous low.
Gas Crypto Price Bearish on Multiple Timeframes
Gas crypto price is bearish on multiple time frames. If the buyers succeed in breaking out of the $10.00 hurdle, then the price may show a sharp rise. But it might be another bull trap so investors must avoid injecting money on this token.
The MACD curve is near the zero line and sloping sideways denoting that the price may consolidate for some more time. The RSI at 51 denotes neutral territory and an equal level of tug-of-war between buyers and sellers.
Conclusion
GAS price surged 14% in the last trading session and formed a bullish candle. However, the upmove looks temporary because it lacks genuine buying. Therefore, investors should avoid investing money in it and search for better alternatives.
Technical Levels
- Resistance levels: $10.01 and $16.05
- Support levels: $7.05 and $6.02
Disclaimer
The views and opinions stated by the author, or any people named in this article, are for informational purposes only. They do not establish financial, investment, or other advice. Investing in or trading crypto assets comes with a risk of financial loss.

With a background in journalism, Ritika Sharma has worked with many reputed media firms focusing on general news such as politics and crime. She joined The Coin Republic as a reporter for crypto, and found a great passion for cryptocurrency, Web3, NFTs and other digital assets. She spends a lot of time researching and delving deeper into these concepts around the clock, and is a strong advocate for women in STEM.


