
 Home
Home News
News
- 1 SOL coin price shows a retracement move toward the 20-day EMA.
- 2 Solana crypto shows a healthy pause and is peeking for a retreat.
Solana coin (SOL) price took a pause and delivered a healthy retracement move after a steady rehab from the bottom mark of $20. Furthermore, a golden crossover was noted near the support zone as the buyers celebrate the gains. Followed by a range breakout above $25, the SOL coin persists in extending the bullishness. There were hints of a recovery to the $50 mark.
Solana coin has supported the 20-day EMA mark and buyers are trying their best to retest the swing high of $70. Per the Fibonacci retracement zone, the Solana coin tumbled from the 61.8% zone and is at the 50% zone near the mid Bollinger band, suggesting higher odds of retaining the higher zones.
The live price of the Solana coin is $55.10 with an intraday drop of 2.89%, showing neutrality on the chart. Moreover, the trading volume increased by 5.43% to $1.32 Billion and the pair of SOL/BTC is at 0.00149. The market cap of the Solana coin is $23.34 Billion. Analysts have maintained a neutral rating and suggest that SOL has the potential to reach $100 in the next few months.
Will Solana Coin Hold the Round Mark of $50?
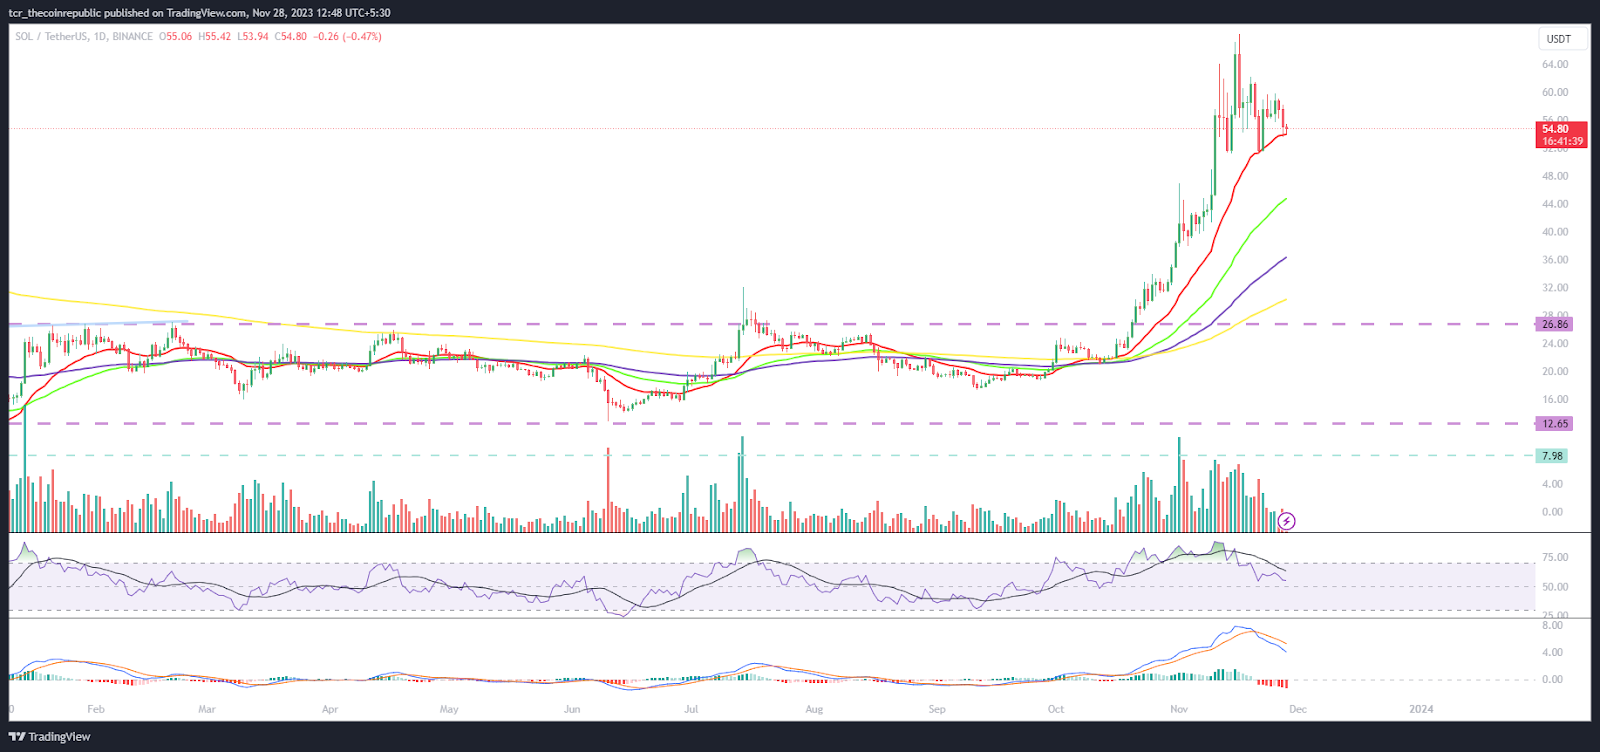
On the daily chart, the SOL coin has attained traction. Moreover, the price action witnessed fresh long expansions and sellers are now on the back foot and felt trapped. Followed by the crypto market pump, SOL coin overtook the supply zone of $50 which gave relief to the short-term traders.
The RSI curve stayed near neutrality close to 60 showing a negative divergence which resulted in a retracement move.
The MACD indicator showed a bearish crossover and formed red bars on the histogram suggesting a volatile outlook for the upcoming sessions.
Weekly Charts Exhibits Range Breakout
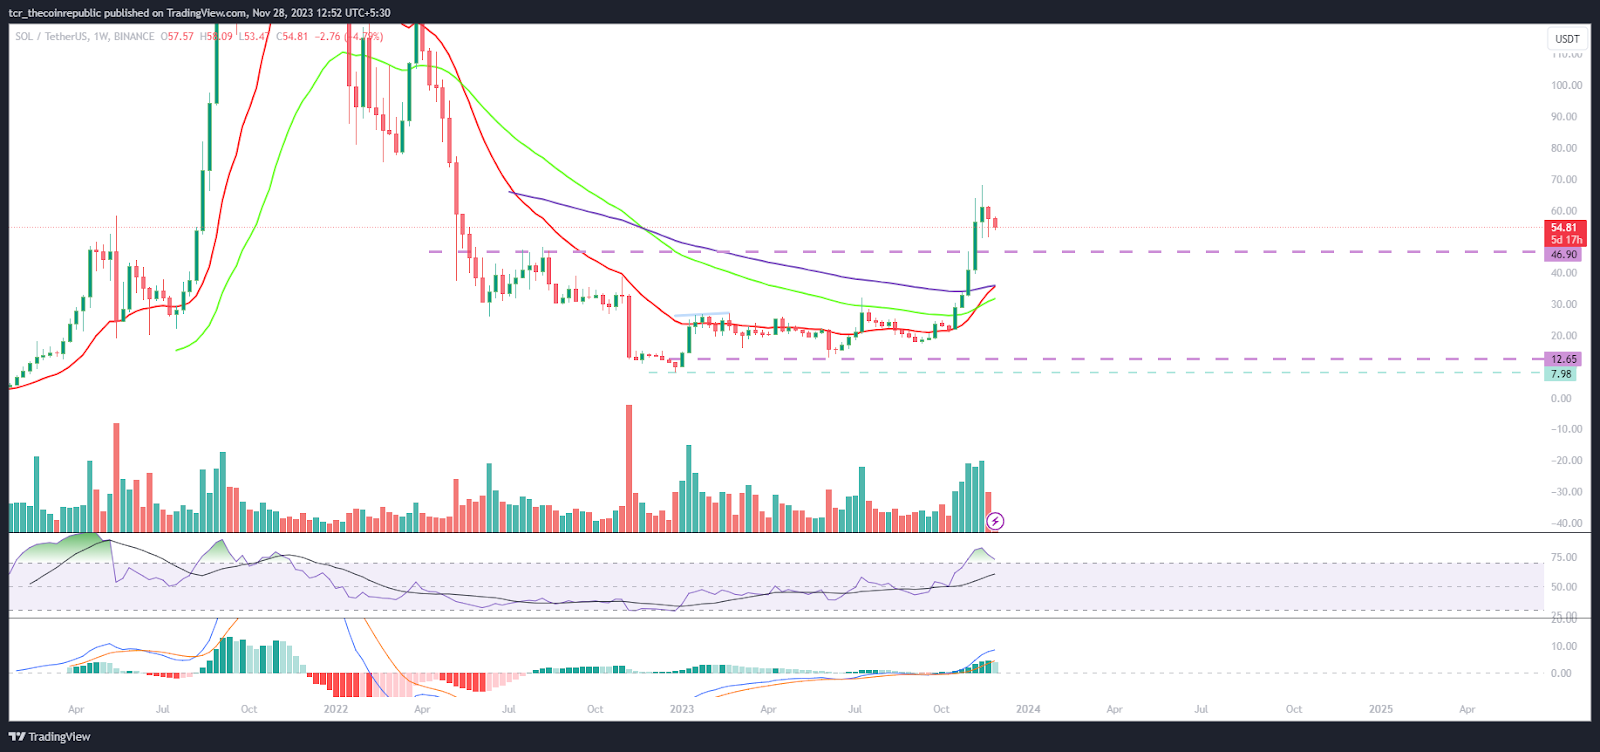
On the weekly chart, the SOL coin flaunts a range breakout, and fresh buying momentum was witnessed. Moreover, the price action showcases a sharp bounce from the bottom mark of $25 and buyers persisted in accumulating the coin and are looking to reach $60 soon.
Summary
Solana coin showcased a bull rally and outperformed the critical hurdle of $50, highlighting the bulls dominance. Moreover, the price action shows that sellers were trapped and covered their positions. Per the golden crossover and range breakout, SOL coin shows bullishness and may reach $70 on a short-term basis.
Technical Levels
Support Levels: $50 and $45
Resistance Levels: $60 and $65
Disclaimer
The views and opinions stated by the author or any other person named in this article are for informational purposes only and do not constitute financial, investment, or other advice. Investing in or trading crypto or stocks comes with a risk of financial loss.

Andrew is a blockchain developer who developed his interest in cryptocurrencies while pursuing his post-graduation major in blockchain development. He is a keen observer of details and shares his passion for writing, along with coding. His backend knowledge about blockchain helps him give a unique perspective to his writing skills, and a reliable craft at explaining the concepts such as blockchain programming, languages and token minting. He also frequently shares technical details and performance indicators of ICOs and IDOs.


