
 Home
Home News
News
- 1 GALA crypto continues to gain slowly & steadily.
- 2 Buyers are accumulating their way to the $0.03000 mark.
GALA crypto price showcased a gigantic surge from the bottom mark of the $0.01270 level, forming a double bottom and breaking out. Afterwards, the bulls persisted in dominating and persisted in accumulating the coin. GALA coin surged over 70% over the last few weeks.
GALA coin has showcased a trend reversal and skimmed from the demand zone of $0.01200. GALA coin is currently steering to catch the supply zone of $0.03000 and buyers have tightened their grip and held their gains decisively. Technicals suggest that GALA coin has acquired traction and looks strong, whereas sellers have lost their momentum and look trapped.
The live price of the GALA coin is $0.02606 with an intraday gain of 2.01% showing neutrality on the charts. Moreover, the trading volume increased by 22.36% to $983.31 Million and the pair of GALA/BTC is at 0.00000684 BTC. However, the market cap of GALA is $196.41 Million. Analysts have maintained an outperform rating and suggest a growth outlook for the upcoming sessions.
Will GALA Crypto Reach $0.03000?
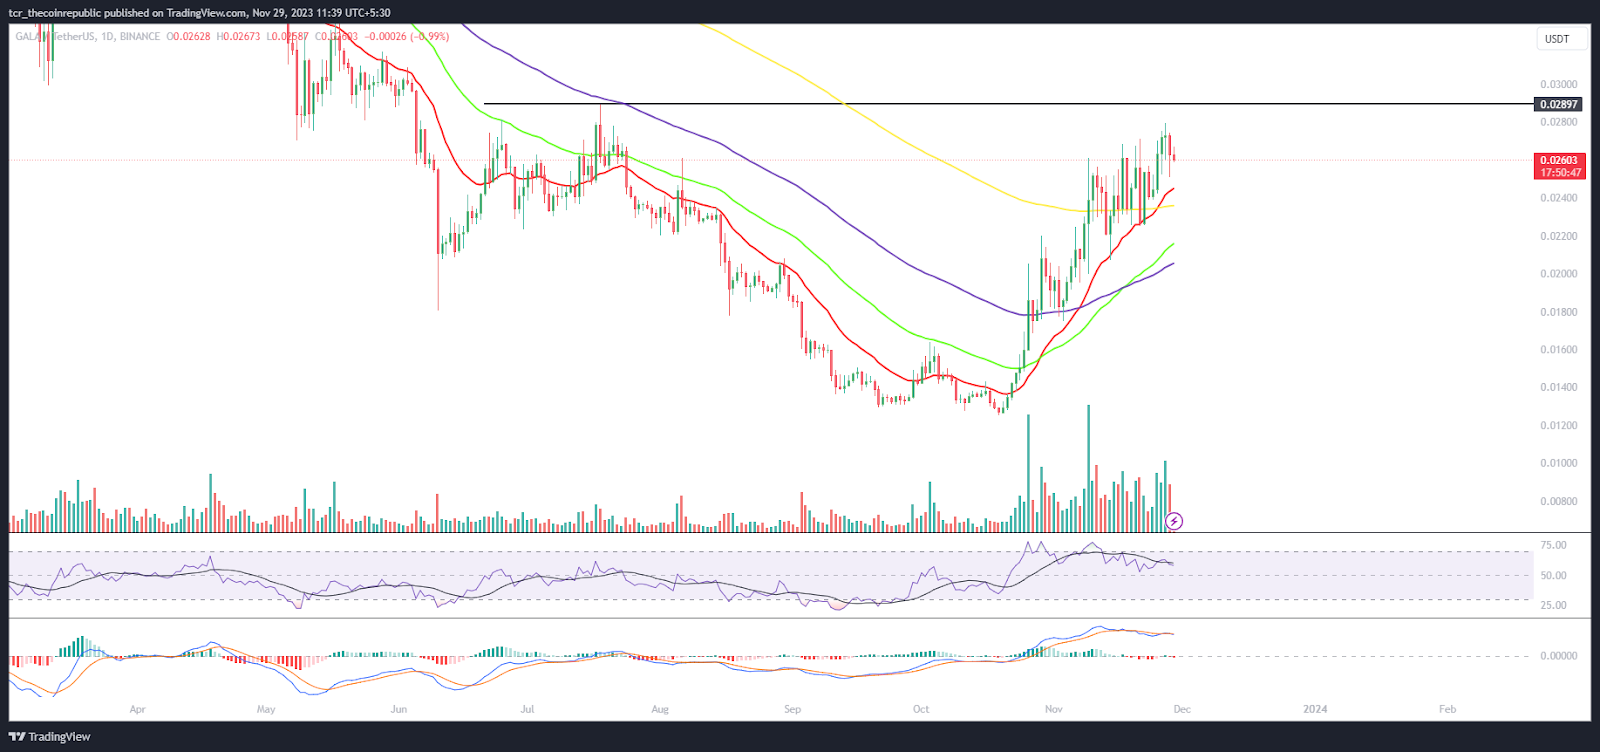
On the daily chart, GALA crypto is forming higher highs, highlighting strong momentum. Additionally, the chart reveals a vertical rebound as the coin surpassed key moving averages decisively. Per the Fibonacci retracement levels, the GALA coin has sustained above the 50% zone and is close to the 61.8% zone near to the upper Bollinger band.
The RSI curve stayed in the overbought zone and formed a positive divergence, indicating strength on the charts. The MACD indicator shows a convergence of the MA line with the signal line.
Weekly Charts Displays Falling Wedge Formation
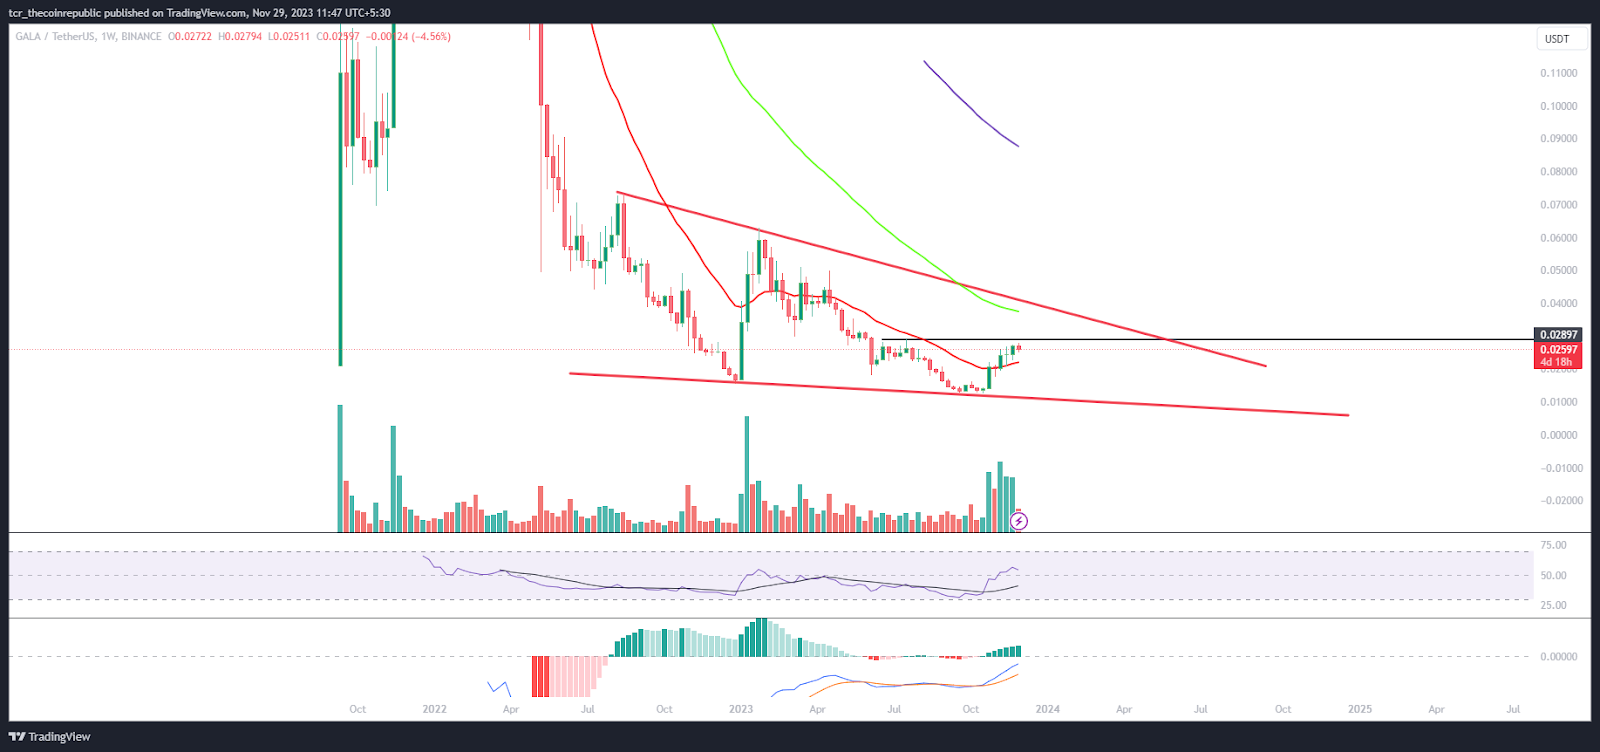
On the weekly chart, GALA crypto produced a falling wedge pattern and exhibited a pullback from the lower trendline of $0.012000. Moreover, the GALA coin is heading to retest the upper trendline of the pattern near $0.03400. Furthermore, the technicals are showing that the GALA coin witnessed a trend reversal and started to form higher highs in the recent sessions.
Summary
GALA coin showcased a trend reversal and glimpsed momentum surpassing the trajectory hurdle of $0.02500, decisively. Furthermore, the GALA coin chart depicted bullishness in the last few sessions. Buyers have maintained their eyes on the upside mark of $0.03500 near the 50-day EMA mark.
Technical Levels
Support Levels: $0.02500 and $0.02200
Resistance Levels: $0.028000 and $0.03000
Disclaimer
The views and opinions stated by the author or any other person named in this article are for informational purposes only and do not constitute financial, investment, or other advice. Investing in or trading crypto or stocks comes with a risk of financial loss.
Anurag is working as a fundamental writer for The Coin Republic since 2021. He likes to exercise his curious muscles and research deep into a topic. Though he covers various aspects of the crypto industry, he is quite passionate about the Web3, NFTs, Gaming, and Metaverse, and envisions them as the future of the (digital) economy. A reader & writer at heart, he calls himself an “average guitar player” and a fun footballer.


