
 Home
Home News
News
- 1 DOT coin is struggling to bounce from the 20 day EMA.
- 2 Buyers are attempting to regain strength and are hovering near $5.00.
Polkadot (DOT) price is showcasing a pause and is hovering near the 20-day EMA mark. However, the DOT price is exhibiting a trend reversal from the lows of $3.50 and witnessed a surge of over 55%. Moreover, the price action highlights the buyers’ efforts as they head for the $6.00 mark. Technicals indicate that the DOT price has sustained the gains in neutral territory and is anticipated to reach the swing high mark of $7.00 in the upcoming sessions.
DOT price is trading above the key moving averages and showed strength. Moreover, the price action is favoring the bulls and suggests that DOT may soon reach the blue sky zone above $7.00 and will skyrocket in the next few sessions.
The live price of the DOT coin is $5.16 with an intraday drop of 2.57% showing neutrality on the charts. Moreover, the trading volume increased by 2.80% to $212.15 Million and the pair of 0.000137 BTC. However, the market cap of DOT is $6.87 Billion. Analysts have maintained a neutral rating and suggest a growth outlook for the upcoming sessions.
Will DOT Price Retest Supply Zone of $6.00?
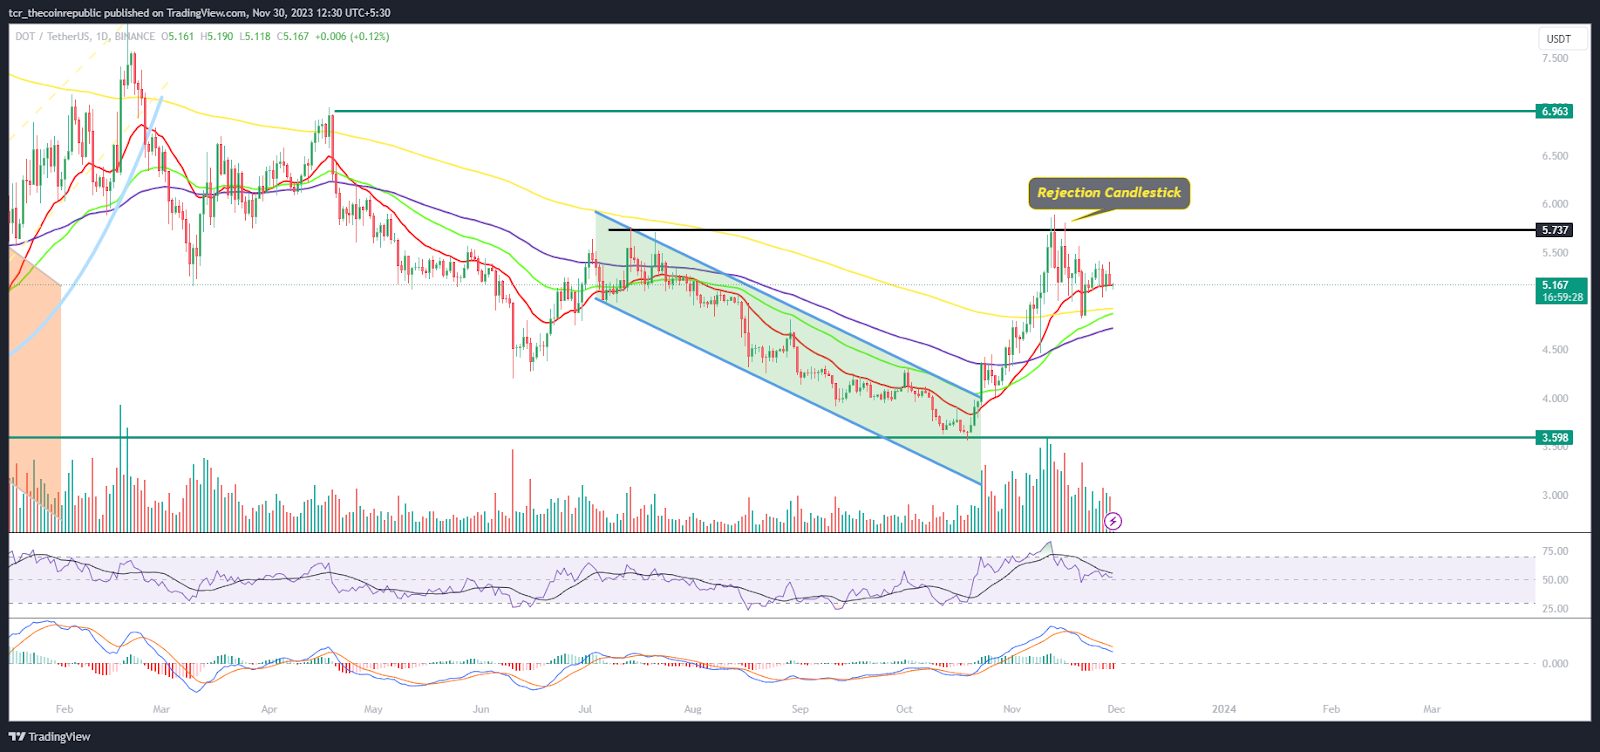
On the daily charts, the DOT coin chart witnessed a trend reversal and started a fresh move from the bottom mark of $3.00. Additionally, the coin has done its correction and is ready to attain a glimpse of bullishness. Moreover, the price action noted investors’ interest and their willingness to retain the bullishness.
The RSI curve stayed in the overbought zone and formed a positive divergence which suggests a potential to reach the bluesky zone of $7.00 soon.
The MACD indicator shows a bearish crossover and red bars on the histogram, suggesting a volatile outlook for the upcoming sessions.
Weekly Chart Shows Rejection From 50 Day EMA
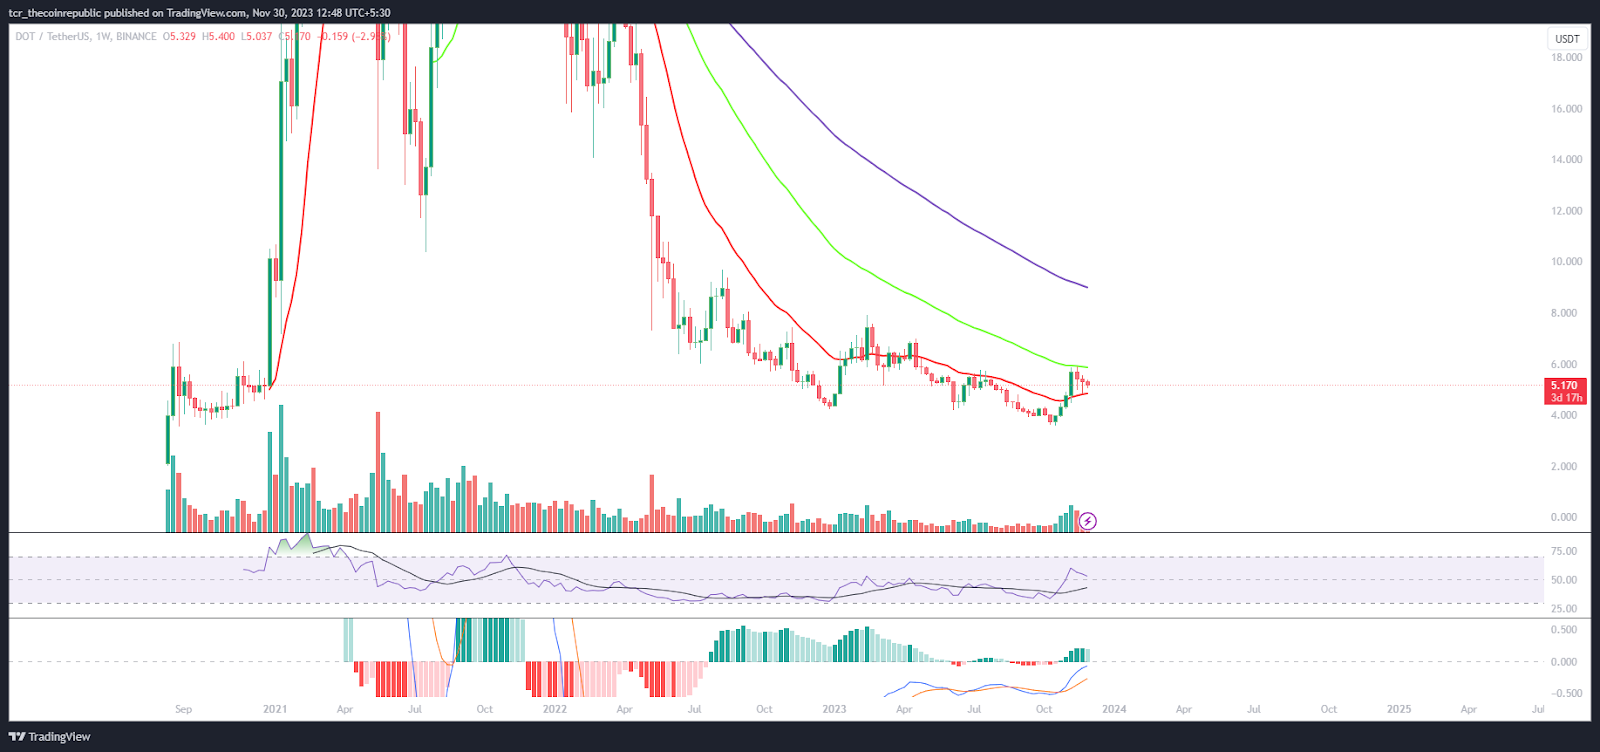
On the weekly chart, DOT price produced a lower highs and lower formation and is close to the trendline mark of $5.30. Furthermore, the buyers are trying to surpass the 50-day EMA mark which acts as a resistance during the pullback.
Summary
Polkadot coin price rebounded from the bottom mark of $3.00 as the price is hovering near the 20-day EMA mark close to $5.00. Moreover, the price action highlights the buyers’ accumulation and suggests that the DOT coin may soon retest the swing high of $6.00. However, the coin is trading near the prompt hurdle of $5.30, which acts as a resistance to acquire strength.
Technical Levels
Support Levels: $5.00 and $4.80
Resistance Levels: $5.60 and $6.20
Disclaimer
The views and opinions stated by the author or any other person named in this article are for informational purposes only and do not constitute financial, investment, or other advice. Investing in or trading crypto or stocks comes with a risk of financial loss.
Steve Anderson is an Australian crypto enthusiast. He is a specialist in management and trading for over 5 years. Steve has worked as a crypto trader, he loves learning about decentralisation, understanding the true potential of the blockchain.


