
 Home
Home News
News
- 1 AGIX price revamped from the lows of $0.15800 noted a reversal.
- 2 Buyers have gained strength and are dominating.
AGIX, the native token of SingularityNET, has bottomed out and witnessed a trend reversal in the recent sessions. Moreover, the token price showed a massive recovery and has surpassed the key moving averages, replicating buyers’ accumulation on the charts. However, the AGIX price is trading near the supply zone of $0.3200 and has faced rejection in the past sessions. Furthermore, the token has attained momentum.
AGIX price has approached the bullish trajectory and reached above the barrier of $0.3000, highlighting bullishness on the chart. The technicals show that the AGIX token has trapped the bears, who have decisively maintained their grip. Meanwhile, the mighty bears have accepted the challenge and attained victory, resulting in a massive short-covering rally in recent sessions.
The live price of the AGIX token is $0.3156, with an intraday gain of 4.78%, showing bullishness on the chart. Moreover, the trading volume increased by 11.05% to $47.70 Million. However, the pair of AGIX/BTC is at 0.00000814 BTC, and the market cap is $357.58 Million. Analysts have maintained a bullish rating and suggest a growth outlook for the upcoming sessions.
Will AGIX Price Gain Momentum Above $0.3200?
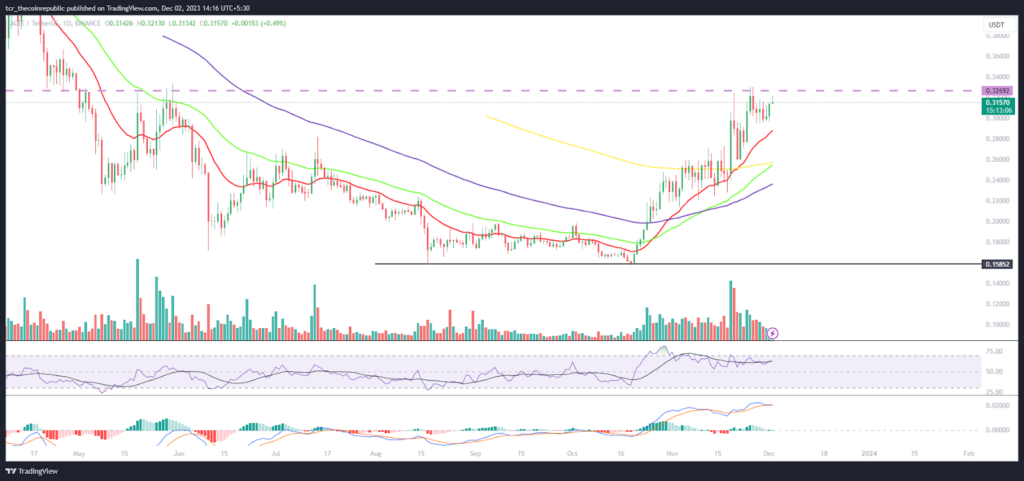
The AGIX price healed massively on the daily chart. It recovered from the bottom support zone of $0.1600, and surged over 100% in recent weeks, highlighting strong investor interest. Moreover, the token has attained pace and decisively escaped multiple hurdles in a single go. The token has begun a reversal, and buyers started gaining traction and are looking to reach $0.3500 soon.
The RSI curve stays in the overbought zone and exhibits a positive divergence, replicating a favourable bullish outlook.
The MACD indicator showed a bullish crossover and formed green bars on the histogram, revealing outperformance on the charts.
Weekly Charts Shows Rebound From Lows

On the weekly chart, AGIX token price has recovered from the lows, approached the 38.2% Fibonacci retracement zone, showing strong buying momentum. The token has showcased a massive surge replicating the short squeeze, as investors are celebrate the rally.
Summary
SingularityNet (AGIX) is on a clear recovery track, having recovered by 120% in the past few weeks, highlighting the bullishness on the chart. The technicals also show that the buyers are accumulating and that the token is on the verge of breaking out of the $0.3300 level. Both RSI and MACD showed bullish crossovers.
Technical Levels
Support Levels: $0.3000 and $0.2800
Resistance Levels: $0.3300 and $0.3500
Disclaimer
The views and opinions stated by the author or any other person named in this article are for informational purposes only and do not constitute financial, investment, or other advice. Investing in or trading crypto or stocks comes with a risk of financial loss.
Steve Anderson is an Australian crypto enthusiast. He is a specialist in management and trading for over 5 years. Steve has worked as a crypto trader, he loves learning about decentralisation, understanding the true potential of the blockchain.


