
 Home
Home News
News

- 1 IOTA price showcased a massive surge over 54% in the recent sessions.
- 2 Buyers have celebrated the bounce and sellers are in trouble now.
IOTA price registered a massive bounce from the 100-day EMA mark and formed a golden crossover on the charts. Moreover, the IOTA crypto established a huge bullish candlestick that escaped multiple hurdles in a single go.
IOTA in News
Recently, in a press release, the company has registered the IOTA ecosystem DLT foundation, the first foundation under the DLT foundation regulation of the Abu Dhabi Global market. The foundation is set to be seeded with $100 Million in IOTA tokens from the Abu Dhabi global market. Afterwards, the IOTA token produced a sharp move, and a massive rally was witnessed in the past few sessions.

As the news broke, massive demand for the IOTA token was witnessed in the form of a spurt in trading volume, and IOTA pulled up sharply beyond the hurdles. IOTA price continued to shoot up and surpassed the trajectory hurdle of $0.2500. Per the technicals, the IOTA price has approached the bullish trajectory, reached the 61.8% Fibonacci retracement level, and sprayed the gains for the past sessions.
The live price of IOTA crypto is $0.2724, with an intraday gain of 20.27%, showing bullishness on the charts. Moreover, the trading volume increased by 25.87% to $159.51 Million. However, the pair of IOTA/BTC is at 0.00000753 BTC, and the market cap is $811.23 Million.
Will IOTA Price Continue to Extend Rally?
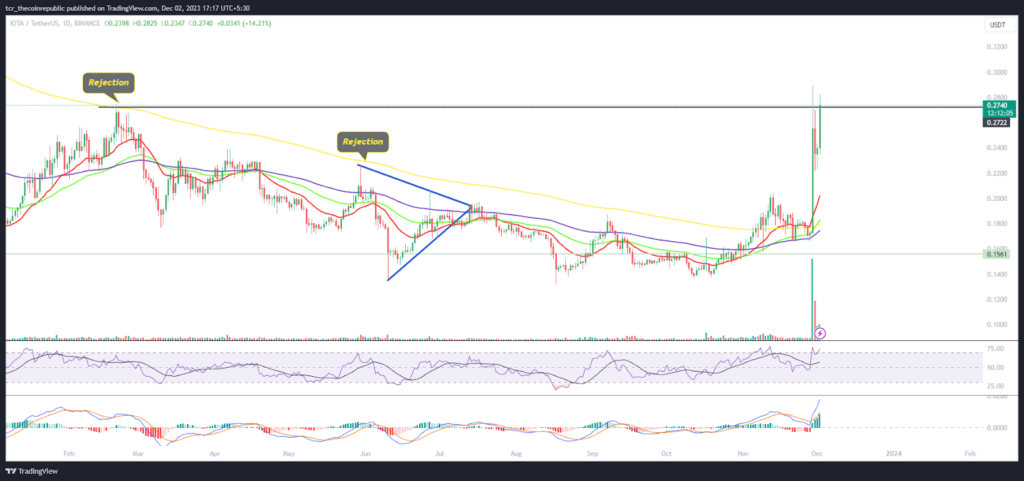
IOTA price enlisted a massive breakout on the daily chart and escaped multiple hurdles in a single shot. The price action highlights the buying momentum as the mighty bulls celebrate the gains and trap the sellers.
The RSI curve stayed in the overbought zone and formed a positive crossover, highlighting the impressive performance on the chart.
The MACD indicator shows a bullish crossover and green bars on the histogram, suggesting a positive outlook for the upcoming sessions.
Weekly Chart Shows a Trend Reversal

On the weekly chart, IOTA crypto price showcased a sharp incline, and a sudden spike in price and trading volume was witnessed in the recent sessions. The technicals depict the range breakout, and the IOTA price fled the bullish region and reached the overbought zone.
Summary
IOTA price showcased a massive recovery from the support mark of $0.1500, noting a sharp rise, and registered a breakout on the charts. Moreover, the price action showed a trend reversal, highlighting bullish dominance in recent sessions.
Technical Levels
Support Levels: $0.2500 and $0.2300
Resistance Levels: $03000 and $0.3200
Disclaimer
The views and opinions stated by the author or any other person named in this article are for informational purposes only and do not constitute financial, investment, or other advice. Investing in or trading crypto or stocks comes with a risk of financial loss.
Mr. Pratik chadhokar is an Indian Forex, Cryptocurrencies and Financial Market Advisor and analyst with a background in IT and Financial market Strategist. He specialises in market strategies and technical analysis and has spent over a year as a financial markets contributor and observer. He possesses strong technical analytical skills and is well known for his entertaining and informative analysis of the Financial markets.


