
 Home
Home News
News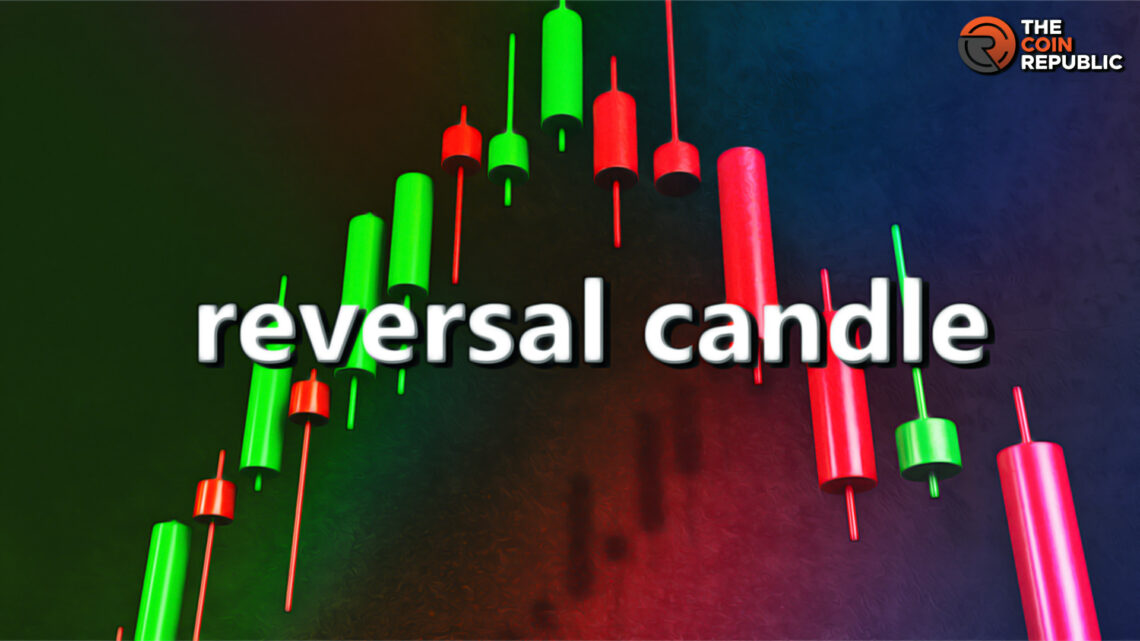
- 1 To analyze the prices of any asset or crypto asset in the market and make investment decisions accordingly, it is important to understand the candlestick pattern.
- 2 Each candle has four data points that is open price, close price, and high and low prices in the given time interval.
- 3 Most investors use various patterns to properly analyze price trends in the markets.
When it comes to making investment decisions in crypto markets, it is important to do both fundamental and technical analysis. To do technical analysis, it is essential to understand timeframes, chart patterns, indicators, support and resistance lines, and many more.
In the space of crypto trading, it is a key challenge to identify potential trend reversals.
Reversal candlestick patterns provide valuable insights into potential changes in the direction of an asset’s price movement. It signals when an upward or downward trend is approaching or coming to an end.
This article will discuss candlestick patterns and parts of the candles, specifically reverse candles. It will explore various bullish and bearish reversal candlestick patterns and their differences that traders or investors can use to build their trading strategies.
Reversal Candlestick Pattern
One or more candles form bullish and bearish reversals, known as reversal candlestick patterns. Traders can use these kinds of patterns to identify a potential reversal in assets’ prices. Candlesticks are the blocks of a price chart.
A reversal candle pattern is a formation of Japanese candlesticks arranged in such a way as to indicate the end of an existing trend in favor of an opposing one.
A reversal candle is no different from a standard structure. It’s the candle grouping and pattern formation that differentiate various candles.
There are many candlestick reversal patterns in existence, but not all of them are equally strong or reliable. Some of the most popular ones include the bullish engulfing pattern, the bearish engulfing pattern, the bullish harami pattern, and the bearish harami pattern.
Understanding parts of a Candlestick
Upper Shadow
The upper wick or shadow indicates a high trading session. If a candle has a longer upper shadow, the asset price surpasses the open and close prices. Conversely, a short upper shadow reflects asset trading close to its opening and closing price.
Real Body
The real body reflects the opening and closing prices. If the candle is a solid red, then the closing prices are lower than the opening prices. Suppose the candle is green, it represents a high closing price.
Lower Shadow
The lower wick or shadow depicts the low trading session. If the lower shadow is long, then the asset prices have moved on the lower side. On the other hand, a short lower shadow depicts asset prices that trade close to a low open or close point.
Bullish vs. Bearish Reversal Candles
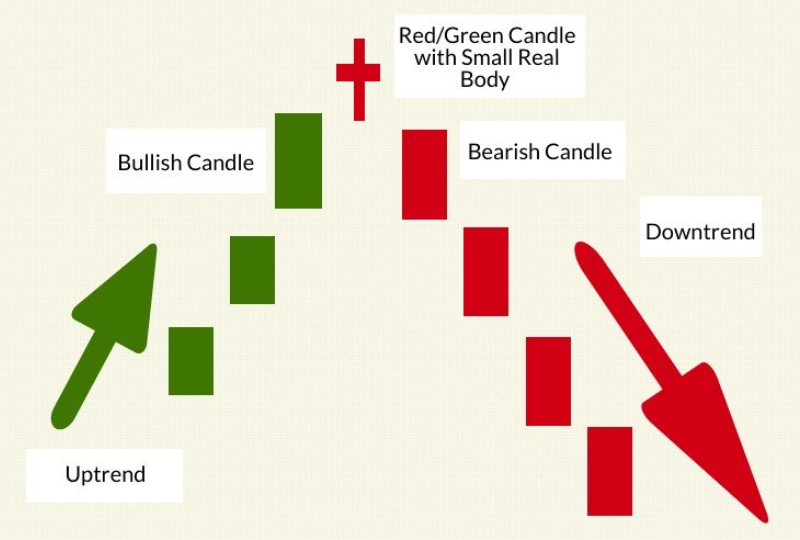
Reversal candlestick patterns can be either bullish or bearish. Bullish reversal patterns occur when the market is in a downtrend and forms a bullish reversal pattern, reflecting an upcoming positive trend in the market.
Bearish reversal patterns occur when the market is in an uptrend and forms a bearish reversal pattern, reflecting an upcoming bear trend in the market.
Types of Reversal Candlestick Patterns
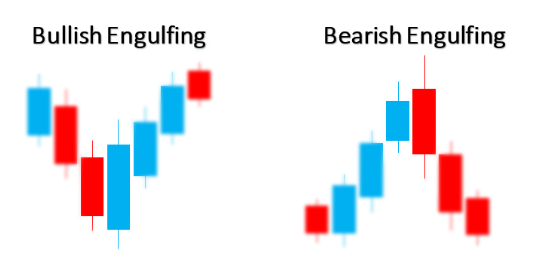
Bullish and Bearish Engulfing
Bullish engulfing is a candlestick pattern that supports buying an asset/crypto when the price is at the bottom of the downward movement.
Whereas bearish engulfing supports the selling of an asset/ crypto when the price marks the top of its upward trend.
Bullish and Bearish Harami
The bullish harami candle analyzes the upward price gap over two days. On the first day, the candle seems to be red, and on the second day, it represents a smaller price movement, indicating an upcoming large bullish trend.
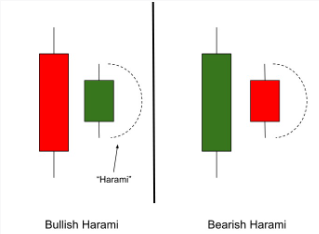
The bearish harami candle represents a very large bearish candle on the first day, and on the second day, the candle becomes smaller, i.e., less bearish.
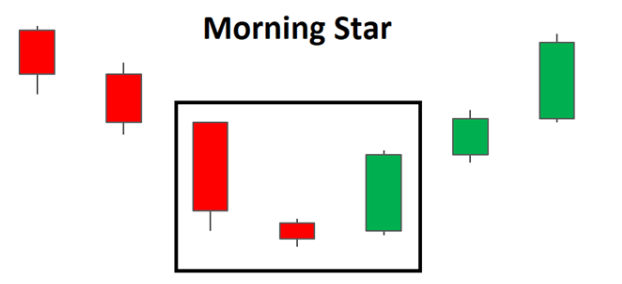
Evening Star and Morning Star
The Evening Star pattern is a candlestick pattern that appears at the end of the uptrend and signals that a downtrend is expected to occur.
The Morning Start is a candlestick pattern that appears at the end of the downtrend and signals an upside reversal.The evening star consists of three candlesticks: a bullish candlestick, a small-bodied candle, and a bearish candlestick.
The morning star also consists of three candles. It reveals a slowing downtrend and an upcoming bullish trend.
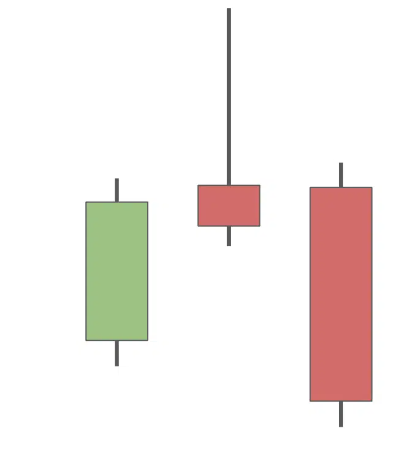
Shooting Star
The shooting star is a bearish reversal pattern formed on one candlestick with a small body, a long upper shadow, and a short lower shadow.
It usually appears after a bullish trend and determines the end of a bullish trend.
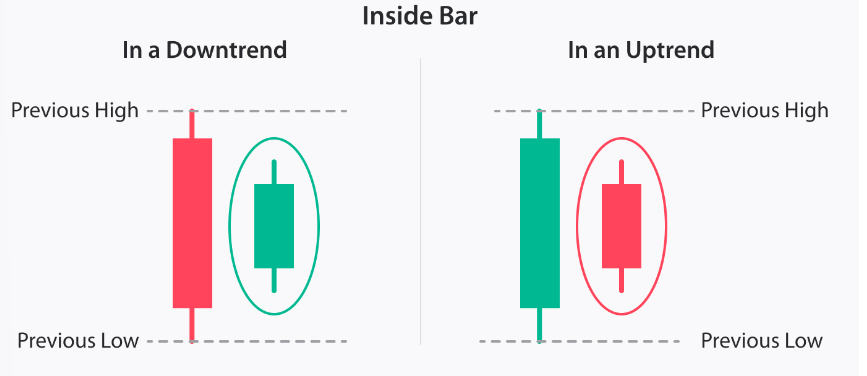
Inside bars
It is a two-candlestick formation that suggests a period of consolidation or indecision in the market. It occurs when a candlestick’s high and low ranges are contained within the high and low ranges of the preceding candle.
Conclusion: Key Factors in Candlestick Patterns
The two key factors that help in understanding and interpreting various chart patterns are as follows:
Shape of the Pattern
The arrangement and sequence of the candles give rise to the pattern’s shape. Some patterns produce large candle bodies, while others produce large wicks or shadows.
Location of the Pattern
When a pattern appears in a downtrend, it indicates a potential rally, changing the trend from downward to upward. Conversely, when a possible reversal pattern forms in an uptrend, it provides a warning to traders that the price may correct or even crash.
FAQs
How do analysts spot a reverse candle?
The best way to spot reverse candles is to remember the most common patterns, such as the bullish and bearish engulfing, morning and evening stars, inside bars, etc.
Which is the most reliable reversal candlestick pattern?
The most popular candlestick patterns to observe a trend in the market are bullish engulfing patterns, morning and evening stars, etc.
What is the best indicator for trend reversal?
No one indicator is best for analyzing trend reversals. Some of the popular reversal indicators include MACD, RSI, etc.

Adarsh Singh is a true connoisseur of Defi and Blockchain technologies, who left his job at a “Big 4” multinational finance firm to pursue crypto and NFT trading full-time. He has a strong background in finance, with MBA from a prestigious B-school. He delves deep into these innovative fields, unraveling their intricacies. Uncovering hidden gems, be it coins, tokens or NFTs, is his expertise. NFTs drive deep interest for him, and his creative analysis of NFTs opens up engaging narratives. He strives to bring decentralized digital assets accessible to the masses.


