
 Home
Home News
News

- 1 ATOM price showed a massive comeback from the $6 mark.
- 2 Buyers are looking aggressive and persist in accumulation.
Cosmos price has recovered the gains and is heading to register a breakout above the prompt hurdle of $10.20, where buyers are looking aggressive, and sellers are trying to protect the region from being splitted. ATOM price is entering into a bullish trajectory, and if it succeeds in escaping the supply zone, it will lead to a sharp bounce, and ATOM will reach the swing of $12 in the upcoming trading sessions.
Cosmos price has justified a meaningful recovery from the lows and noted a V-shaped reversal, indicating bullish momentum on the chart. Moreover, the ATOM price is trading beyond the key moving averages and is climbing the gains in the bullish territory. Furthermore, the ATOM price has persisted in forming higher high swings and replicated the bulls’ dominance.

The live price of Cosmos (ATOM) is $10.17, with an intraday gain of 5.97%, showing bullishness on the chart. Moreover, the trading volume increased by 5.67% to $237.54 Million. However, the pair of ATOM/BTC is at 0.000231 BTC, and the market cap is $3.36 Billion. Analysts have maintained a bullish rating and suggest ATOM price will continue to skyrocket and may reach the bluesky zone above $12 soon.
Cosmos on Daily Chart Displays Double Bottom Formation
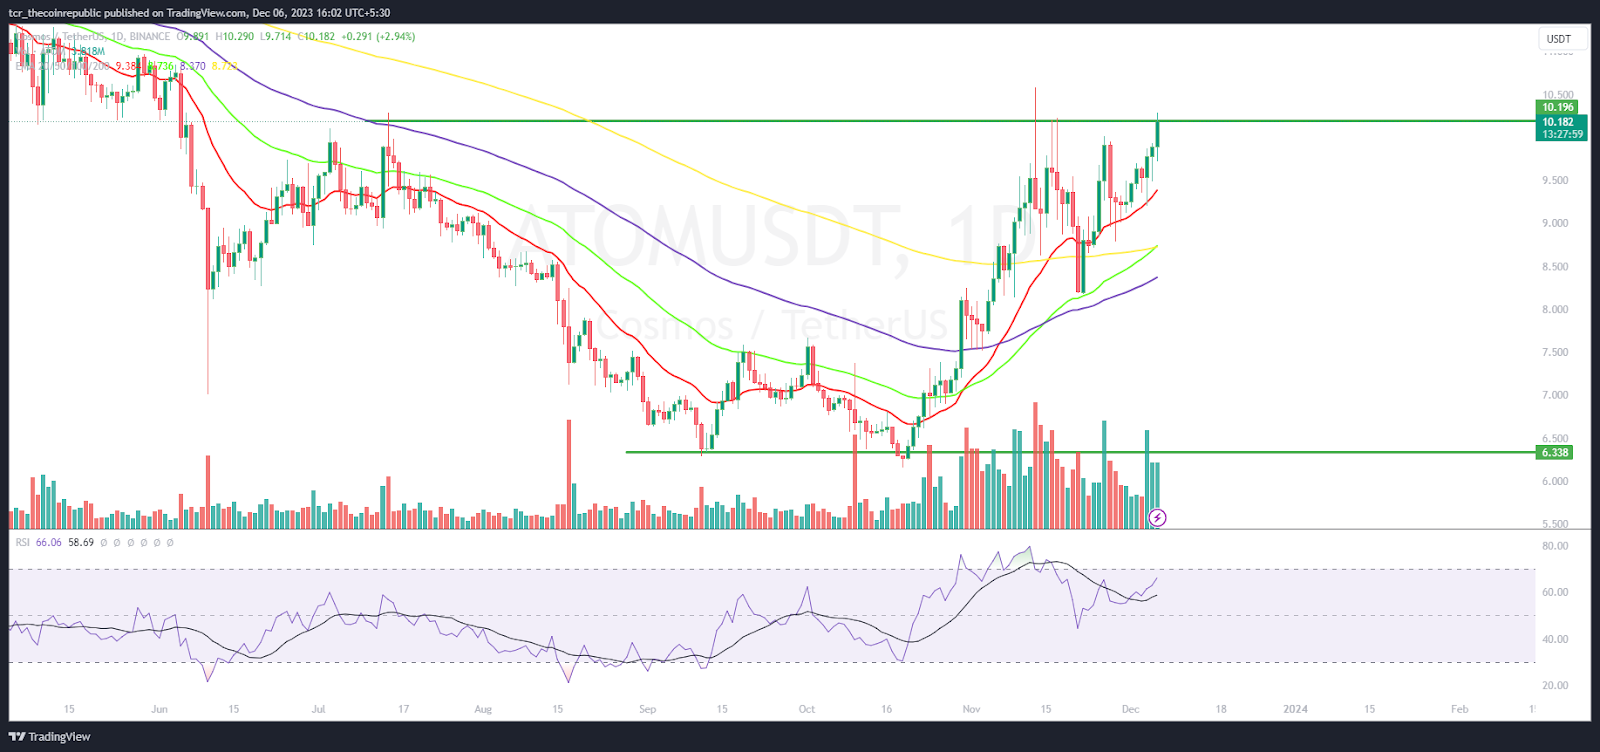
On the daily chart, Cosmos price (ATOM) showed a massive comeback and established a double bottom pattern at the bottom mark of $6. Afterward, buyers succeeded in initiating a slow & steady rehab. The price action highlights the bullish momentum, and that sellers are covering their positions and are in fear.
The RSI curve stays above the midline and forms a positive crossover, displaying outperformance on the charts.
The MACD indicator showed a bullish crossover and formed green bars on the histogram, suggesting a favorable bullish outlook for the upcoming sessions.
Weekly Charts Exhibits Bulls’ Dominance
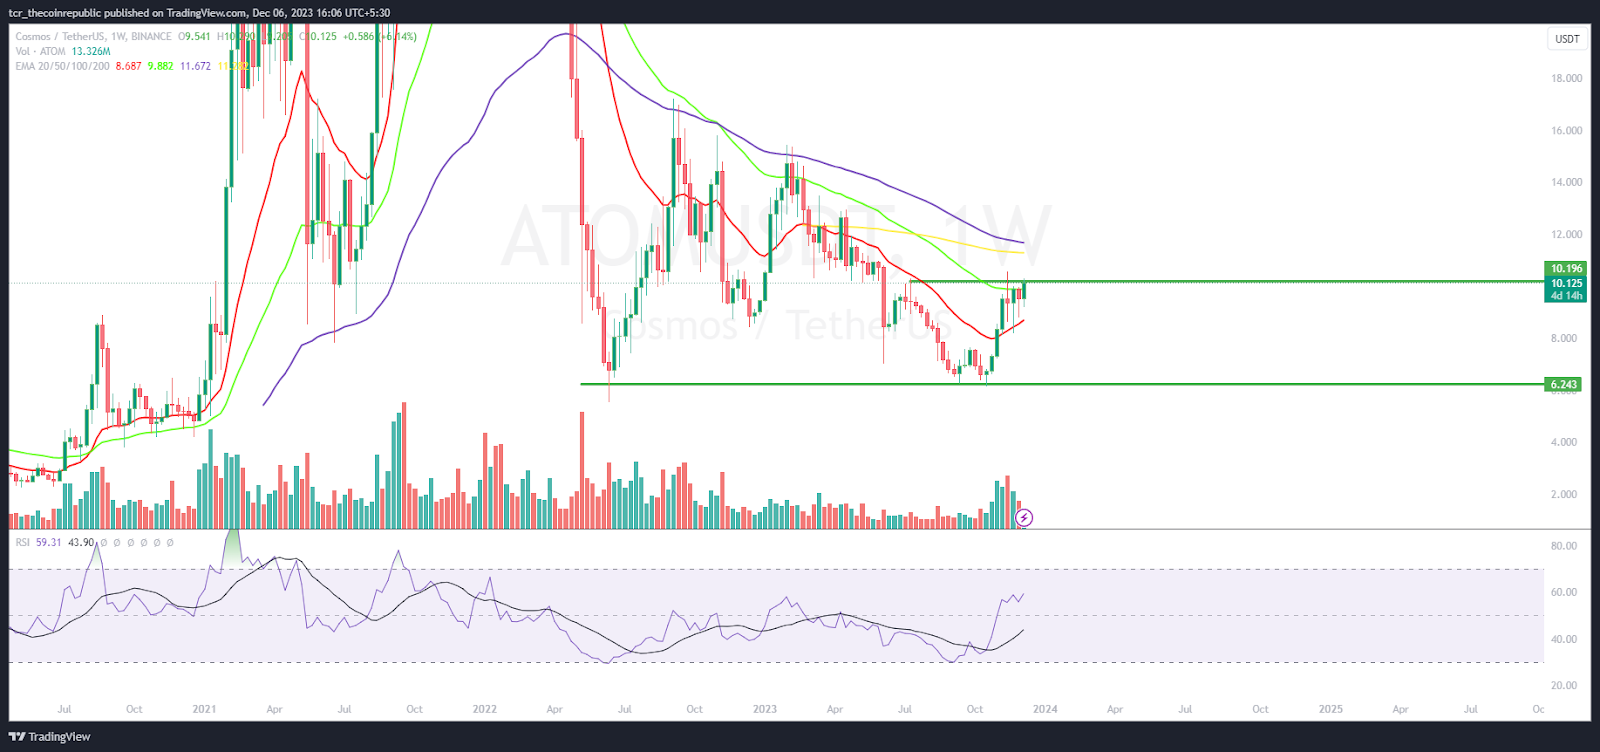
On the weekly chart, ATOM price has surpassed the 50-day EMA, and buyers are attempting to extend the gains beyond the round mark of $10 to enter the bullish trajectory. Meanwhile, the sellers look trapped and try to protect the region and tighten their grip.
Summary
Cosmos price reached the bullish territory and replicates bullish momentum, where buyers are now gaining traction and look aggressive. Furthermore, ATOM price has surpassed the round mark of $10 and showing the bullish reversal pattern on the chart. Additionally, the technicals suggest buyers are looking strong now and that the ATOM price will reach $12 soon.
Technical Levels
Support Levels: $10 and $8.60
Resistance Levels: $11 and $13
Disclaimer
The views and opinions stated by the author or any other person named in this article are for informational purposes only and do not constitute financial, investment, or other advice. Investing in or trading crypto or stocks comes with a risk of financial loss.

Andrew is a blockchain developer who developed his interest in cryptocurrencies while pursuing his post-graduation major in blockchain development. He is a keen observer of details and shares his passion for writing, along with coding. His backend knowledge about blockchain helps him give a unique perspective to his writing skills, and a reliable craft at explaining the concepts such as blockchain programming, languages and token minting. He also frequently shares technical details and performance indicators of ICOs and IDOs.


